Here are some interesting graphs, extending on my previous posts about this.
For context, I have
-
One Outdoor unit with the PMS5003T sensor
-
Three ‘New’ indoor AirGradients with the (needs a correction algorithm) PMS5003 sensor (Labelled ‘New’)
-
Two older indoor units I purchased in June 2024 that happen to have the (supposed to be used in the Outdoor version) PMS5003T - these are called ‘June’/‘Old’
I have one ‘New’ and one ‘June’ unit in each location - Kitchen, and Lounge - which are about 3 meters away from each other. Lounge is near a window which may get some leakage from outside, and Kitchen happens to be near the slit system aircon (for context)
These graphs are for the past 24 hours:
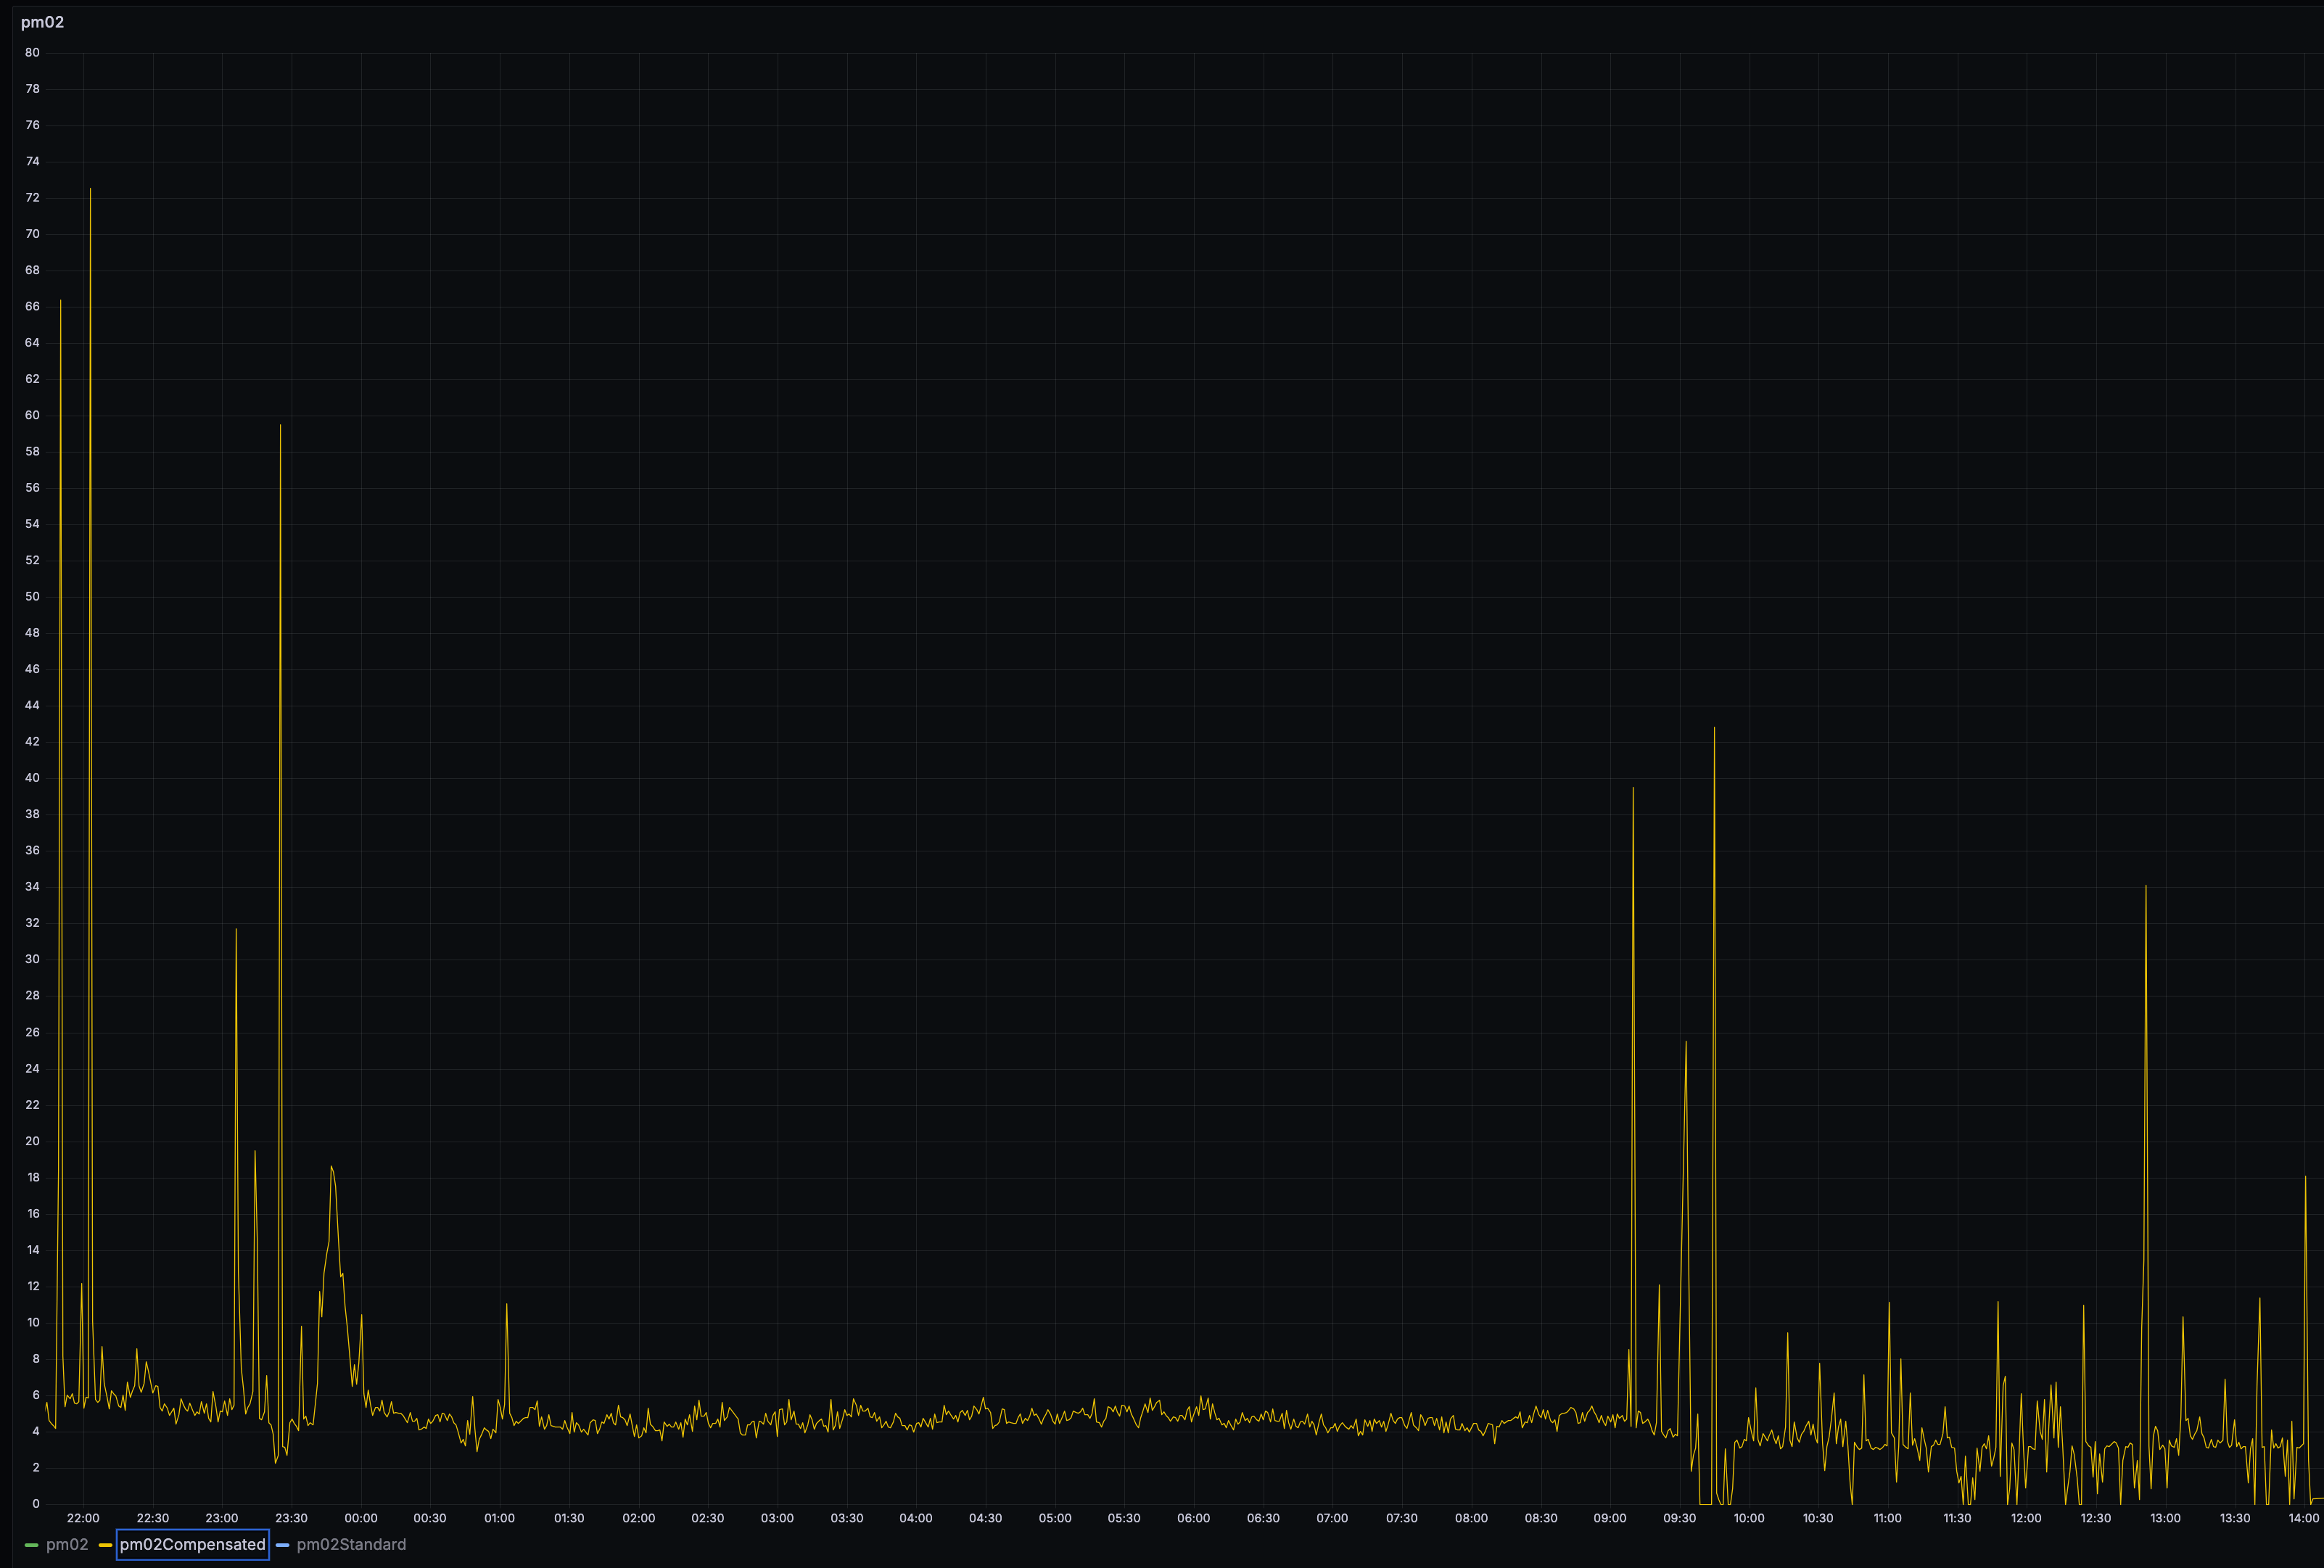
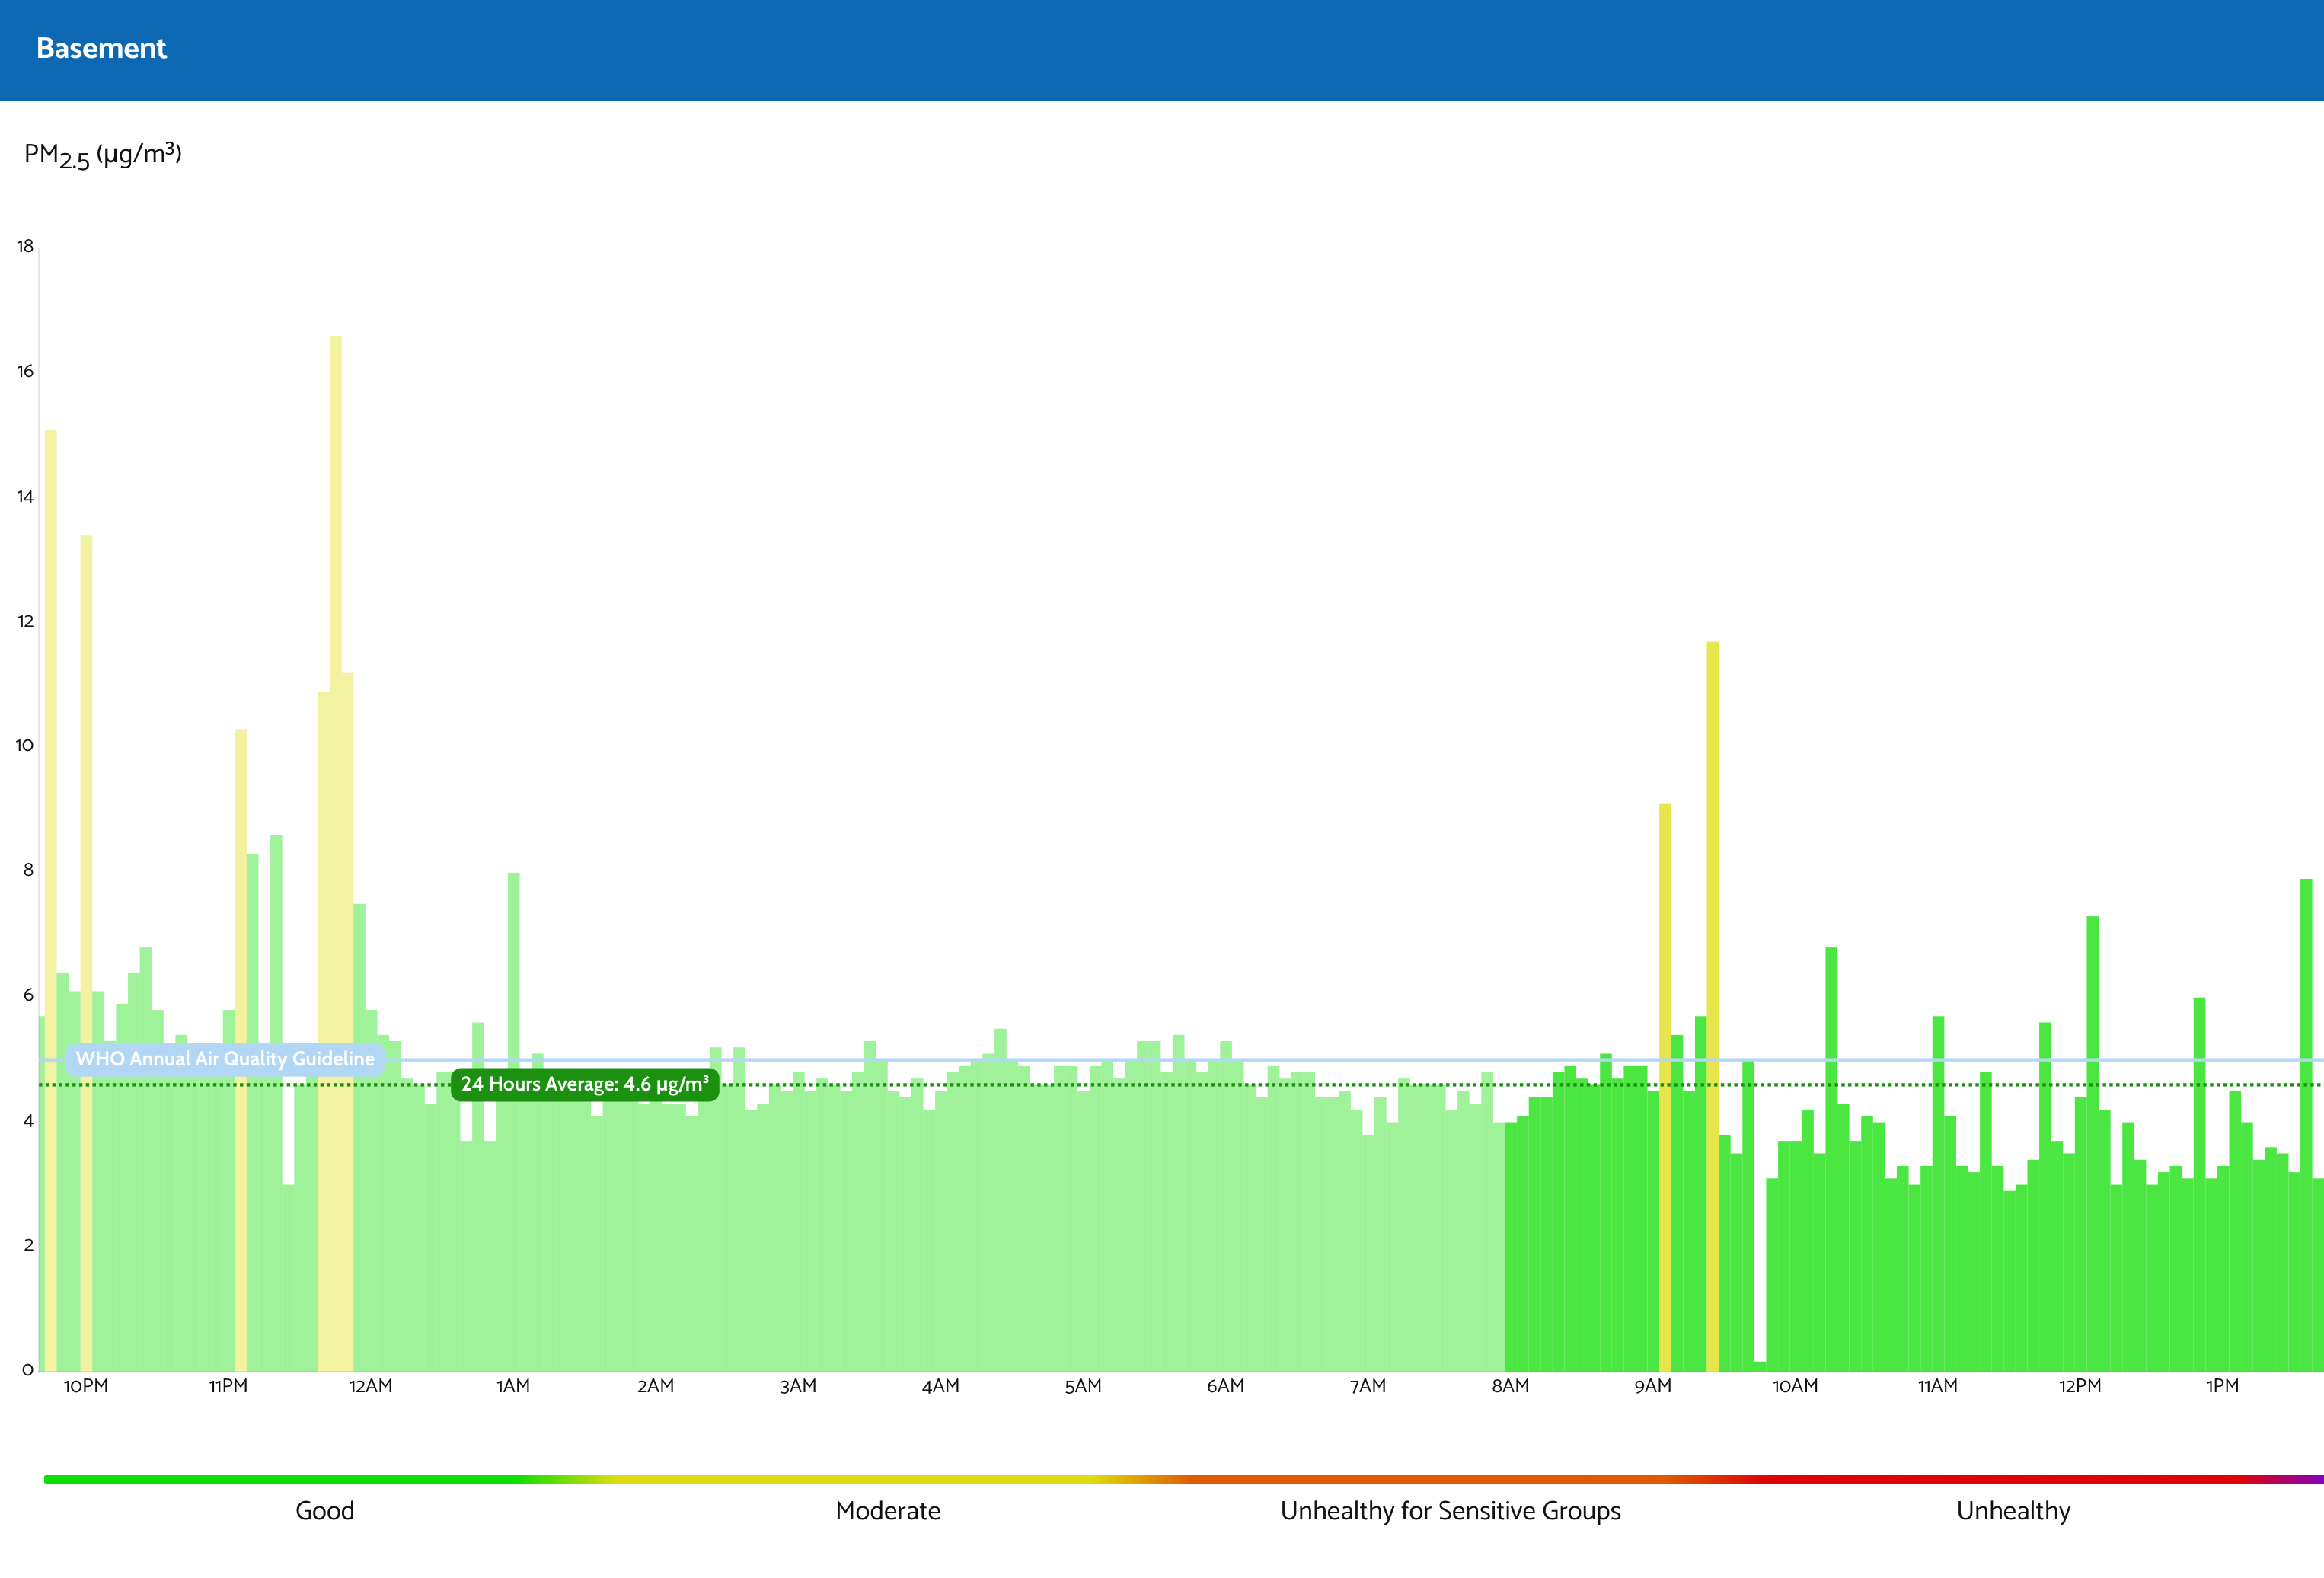
PM2.5 measurements
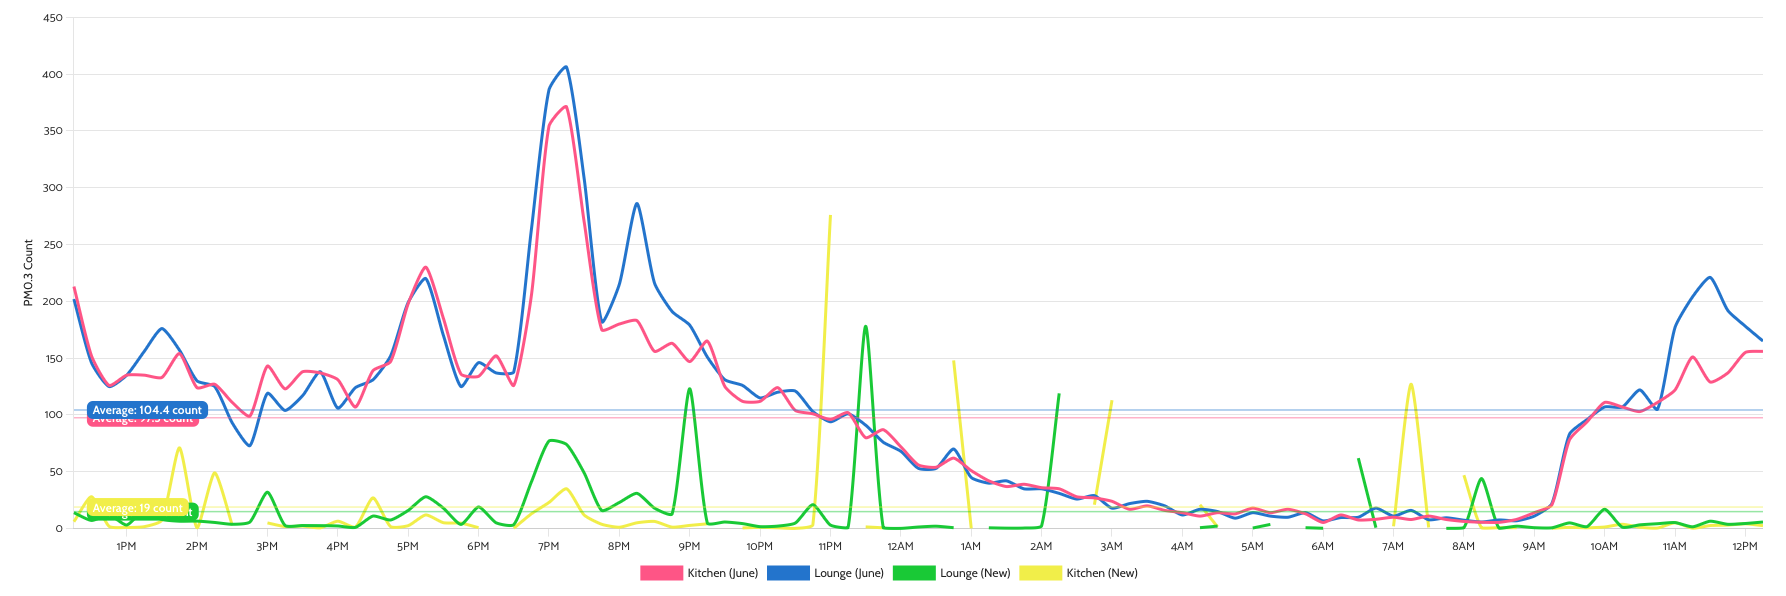
The PM0.3 count (which I’m told is not accurate, but is what the PM2.5 algorithm is based on?)
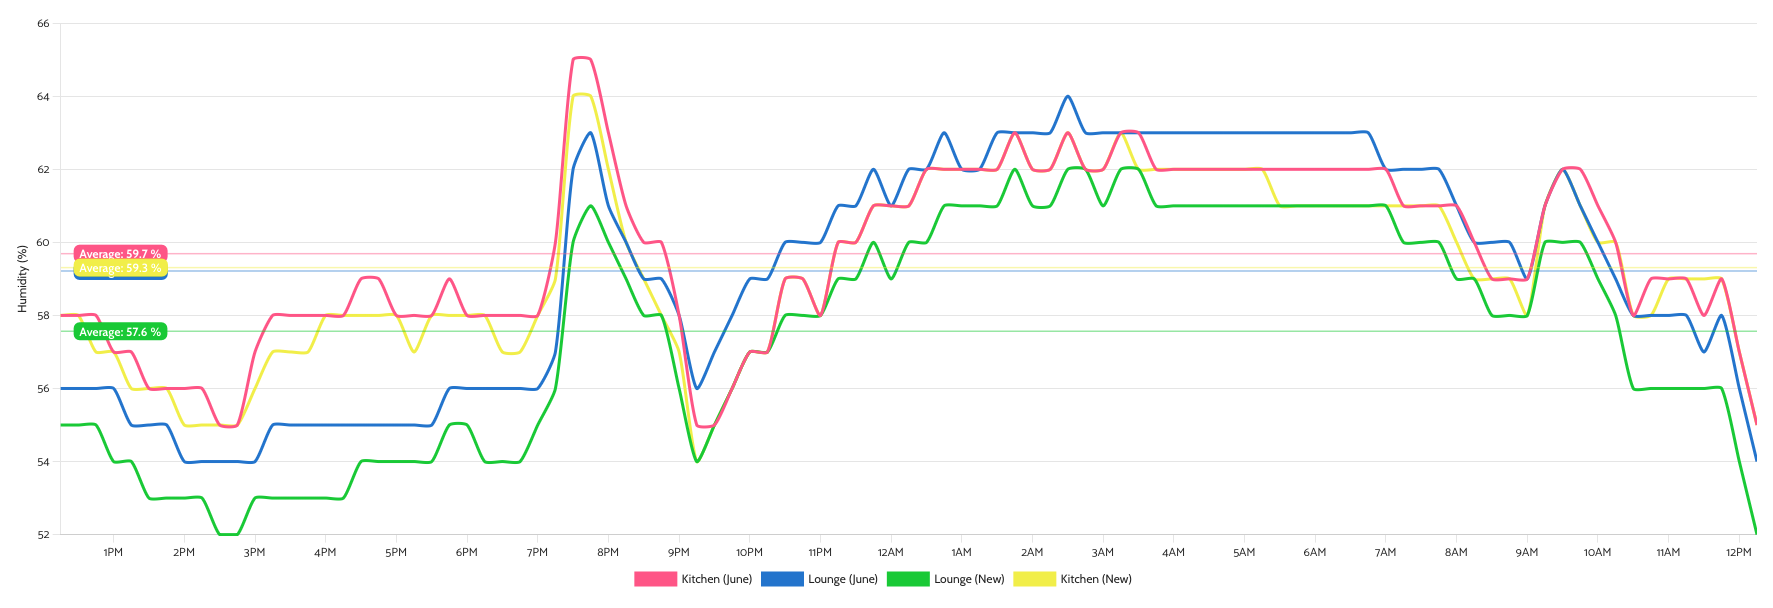
Humidity
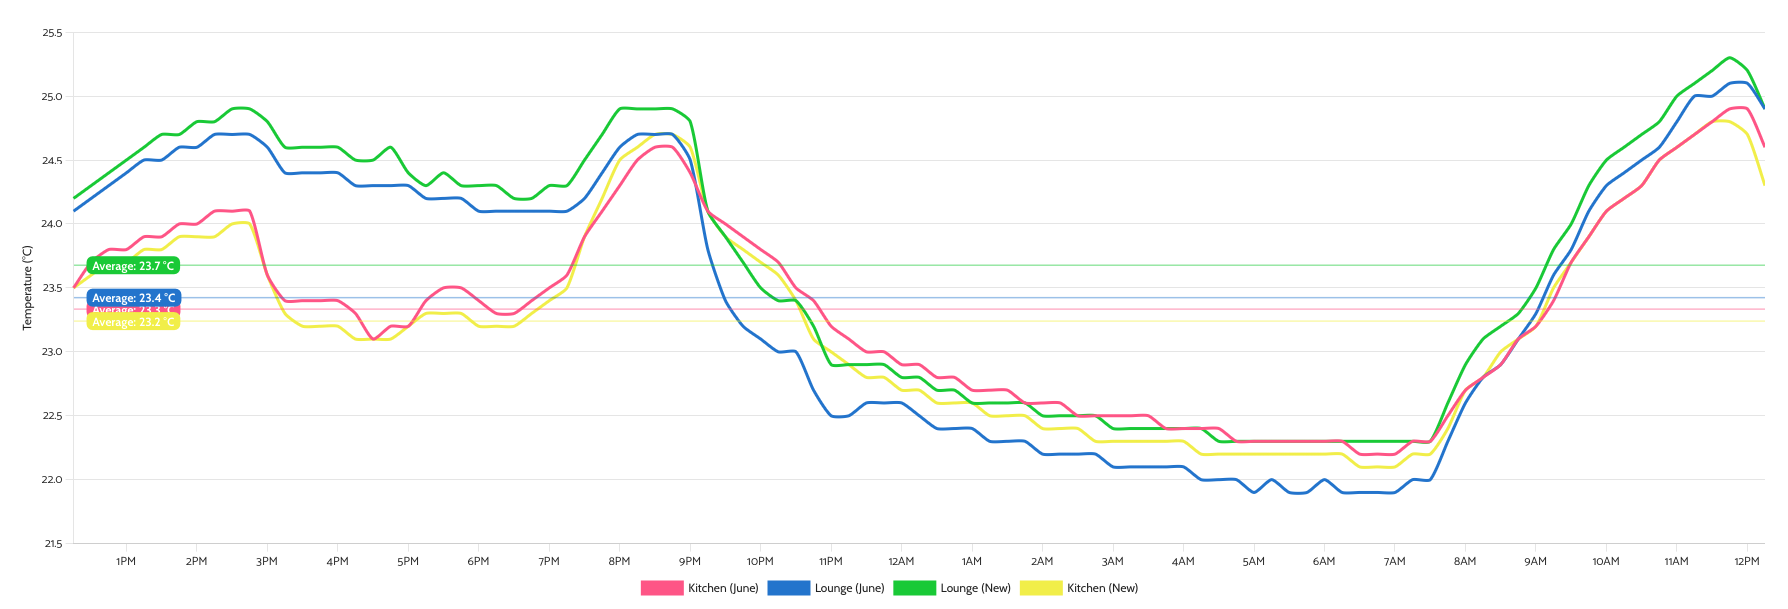
Temperature
You can see that humidity and temperature for the units - especially each pair - are closely correlated.
As well as the PM0.3 count for the two June units.
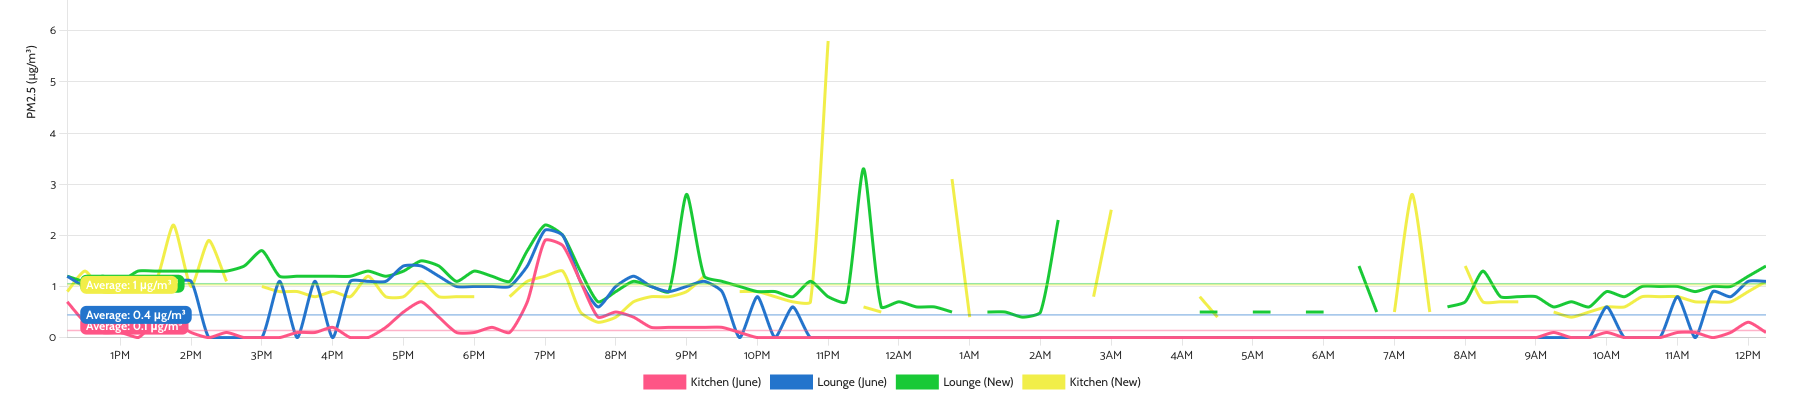
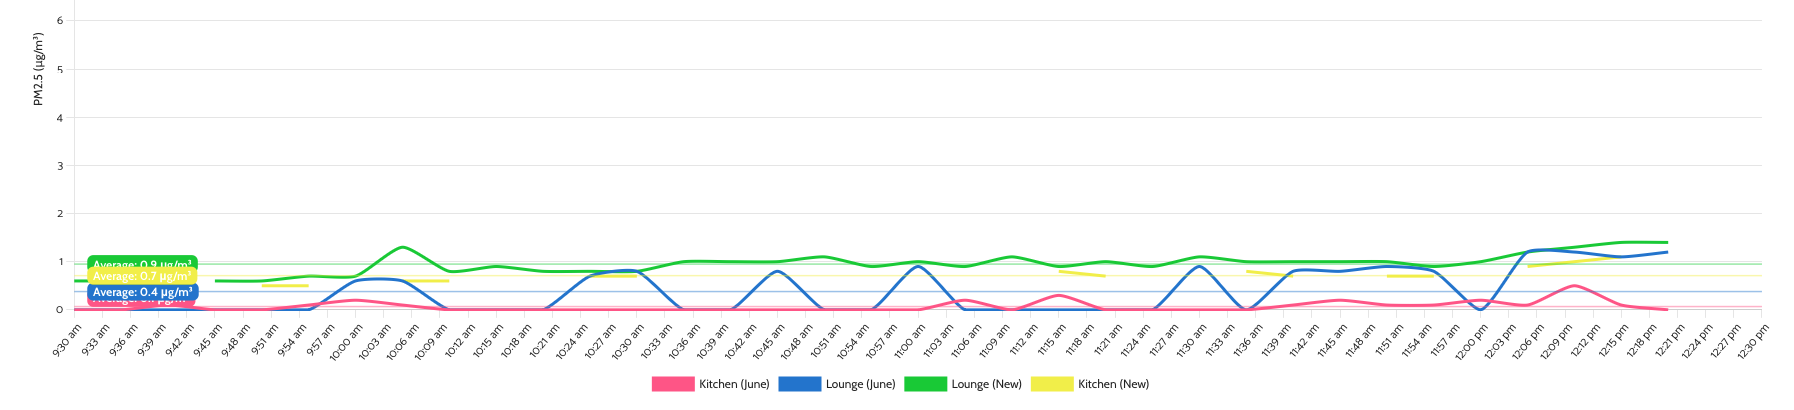
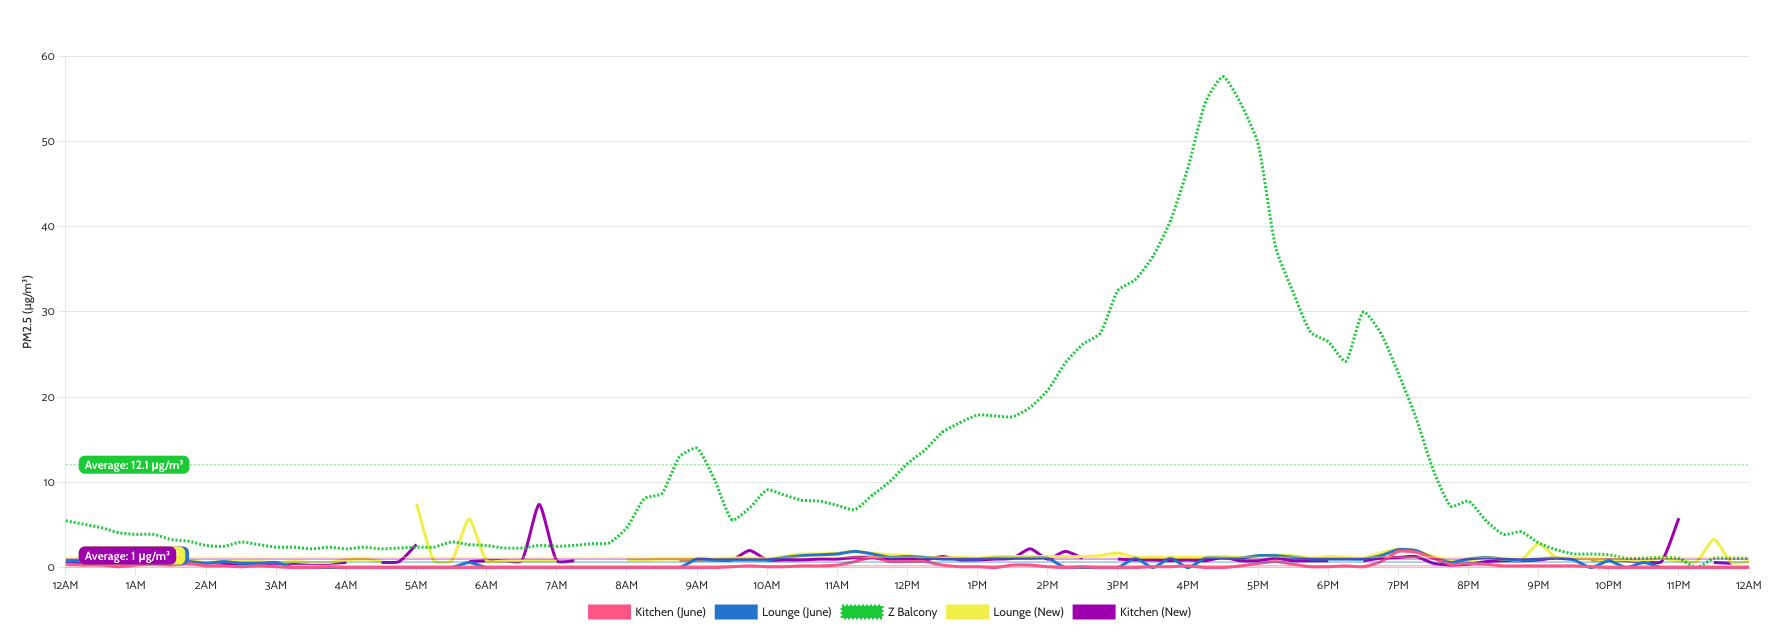
I’m wondering if in fact the new sensors are the accurate ones in relation to PM2.5. There’s obviously still some discrepancy between the old and new units, but some elements of the data have caused me to consider ‘Which model is accurate?’ - look at this graph for the past 3 hours for example.
You can see here that Kitchen (June), 3 meters away from the window that I think lets some outside air in, is consistently near zero. Lounge (June), next to that window, bounces from 0 up to 1 now and then.
Yet Lounge (New) consistently shows that benchmark of about 1 ug/m3 - with the old sensor ‘agreeing’ with that measurement now and then.
Is this a case of the old sensor only finding some PM2.5 particles to measure sporadically, where the new sensor - more accurately measuring PM0.3 and using this as a basis for PM2.5 measurement - consistently finds the particles and can extrapolate the correct PM2.5 measurement from that?
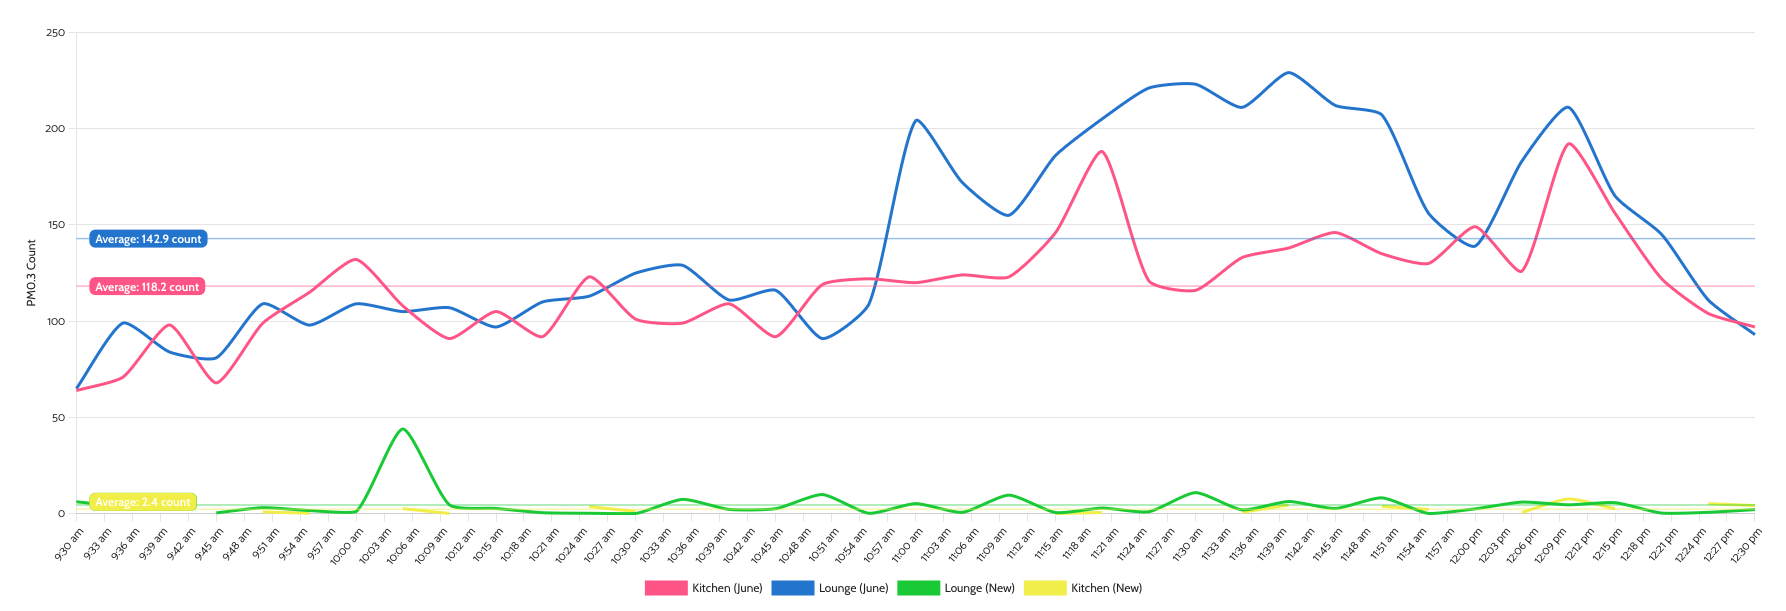
Here is the PM0.3 graph from the last 3 hours
The Kitchen (new) sensor (Yellow) sometimes reports no PM0.3 measurement, which is likely why the PM2.5 measurement also is sporadic. I’d suggest this is to be expected where the unit is located because it’s nearer the air filters and further from the window, but that isn’t reflected in the ‘June/Old’ sensor measurements…
The reason why I’m trying to understand the accuracy of the sensors is because I’m building a filter system that is capable of this performance - whilst being cost effective, repairable, and quiet:
Hence why I’m trying to measure it’s performance, especially during days like yesterday when we had significant bushfire smoke haze.
Even though this Plantower issue creates some questions, I really value the discussion we’re having on it. I think it’s far more transparent and constructive than buying a ‘name brand’ unit and simply hoping/trusting that the number it reports is somewhat correct.
I’ve done that before, and now I leave that unit to simply control my airconditioner…
Thanks to everyone who’s putting time into this!

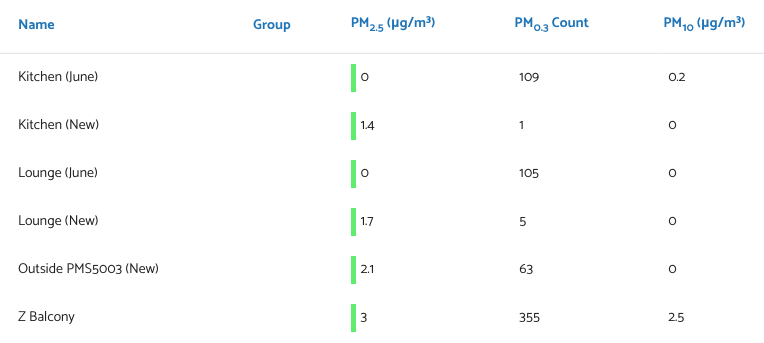
 That sensor called ‘Outside PMS5003 (New)’ was in my Bedroom - I just realised I could put that outside instead, to see how it’s readings correlated with the PMS5003T sensor in the Outdoor AirGradient. They’re about a meter from each other but should still provide some interesting observations.