AirGradient Forum

Max reportable AQI? (Contaminated by irrelevant spew . . . perhaps don't read . . . )

We are in the midst of a huge smoke plume from Canadian wildfires, and I note that the reported AQI on my outdoor monitor has maxed and flatlined at 500 . . . Is this to be expected, or ??? (Other PM readings still appear to be unbounded. . . . )

Update: Other “reputable” sites are now reporting us to be at 709 AQI . . . AG is still parked at an AQI of 500 . . . Not good for accurate info!

Several more hours, now 783. AG still maxxed at 500 . . .
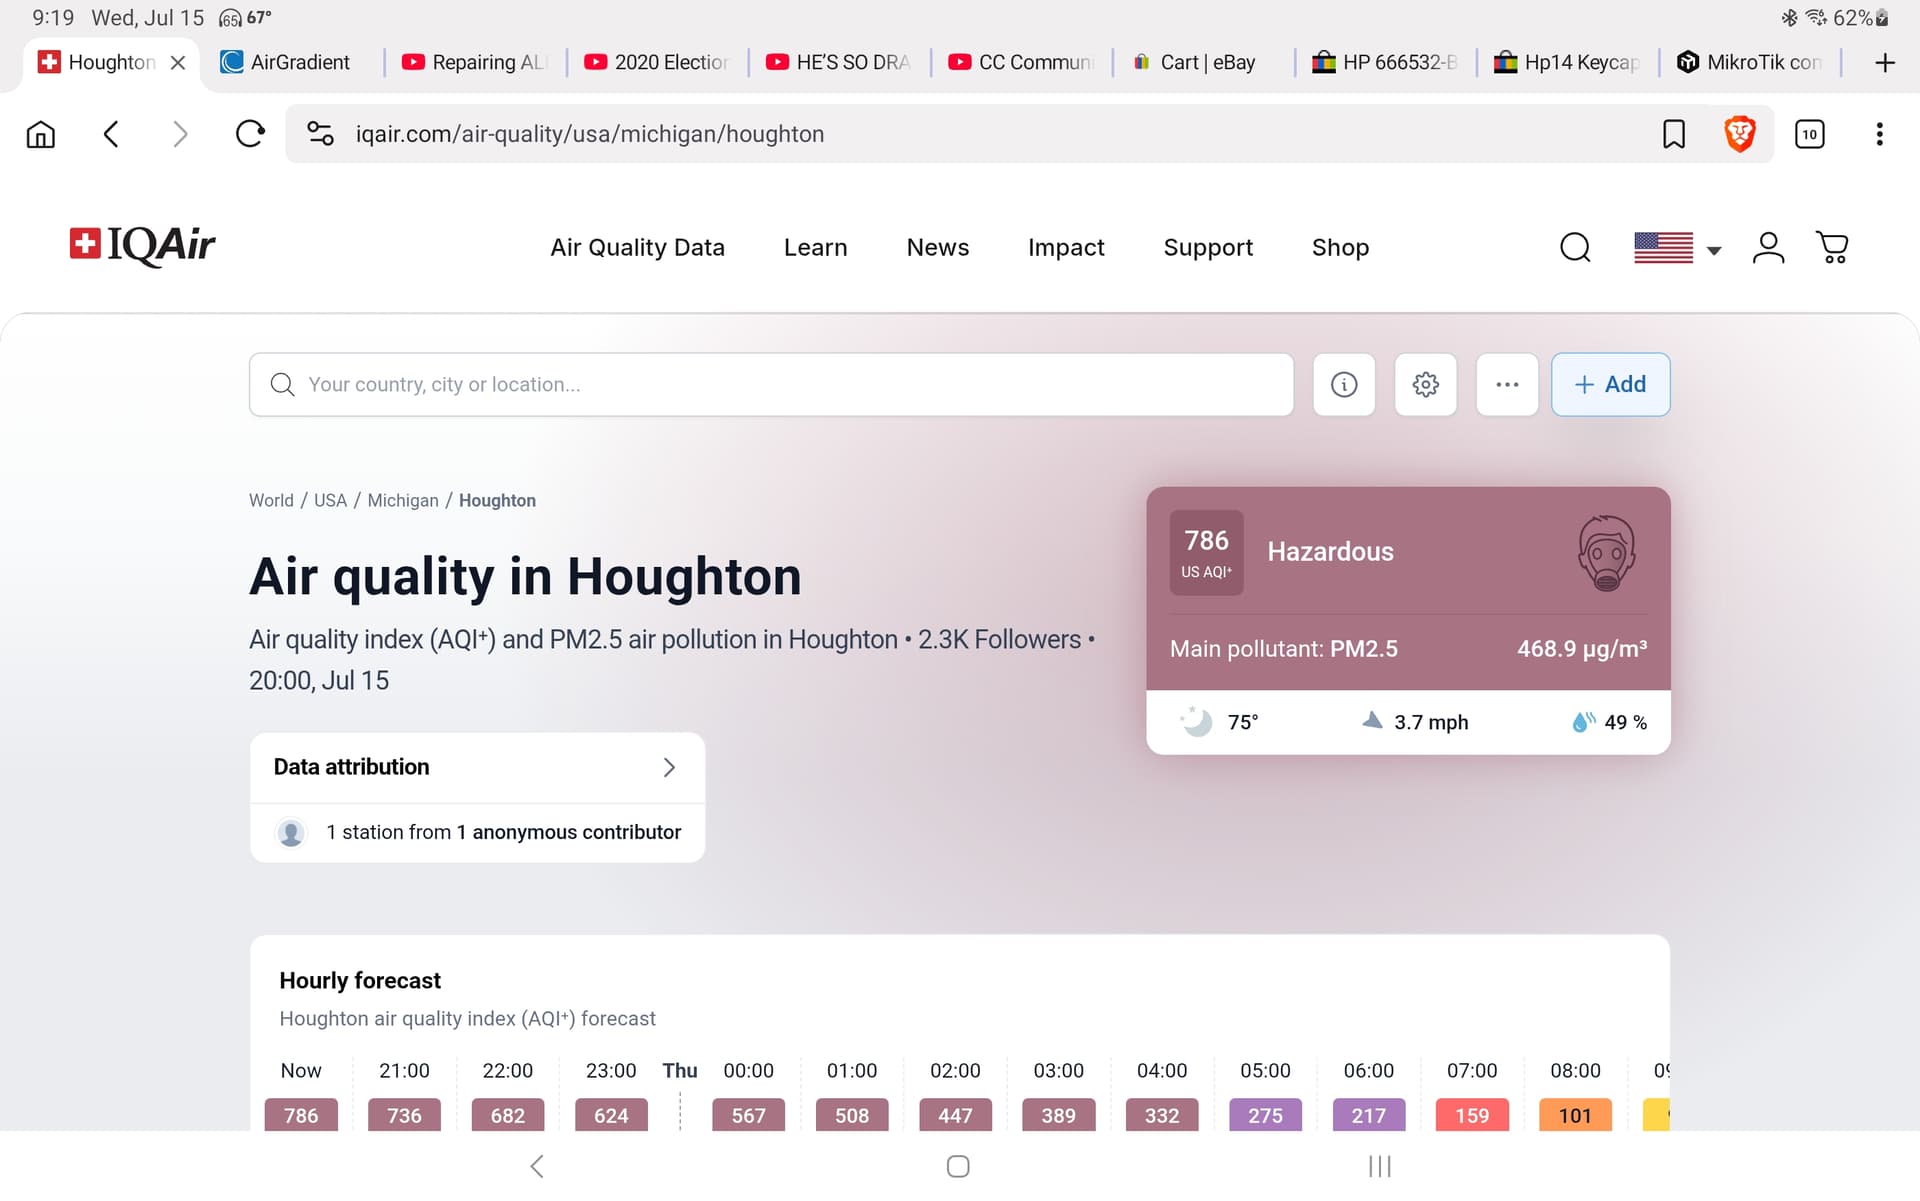
I thought the AQI scale maxed out at 500 and I could get AI to confirm it, but when looking for documentation, I found this:

It doesn’t specify a max that I found but did have a mention that it is linear beyond 500, if in understanding it right.

I think AirGradient maxes at 500, but I’ll let someone from the team chime in

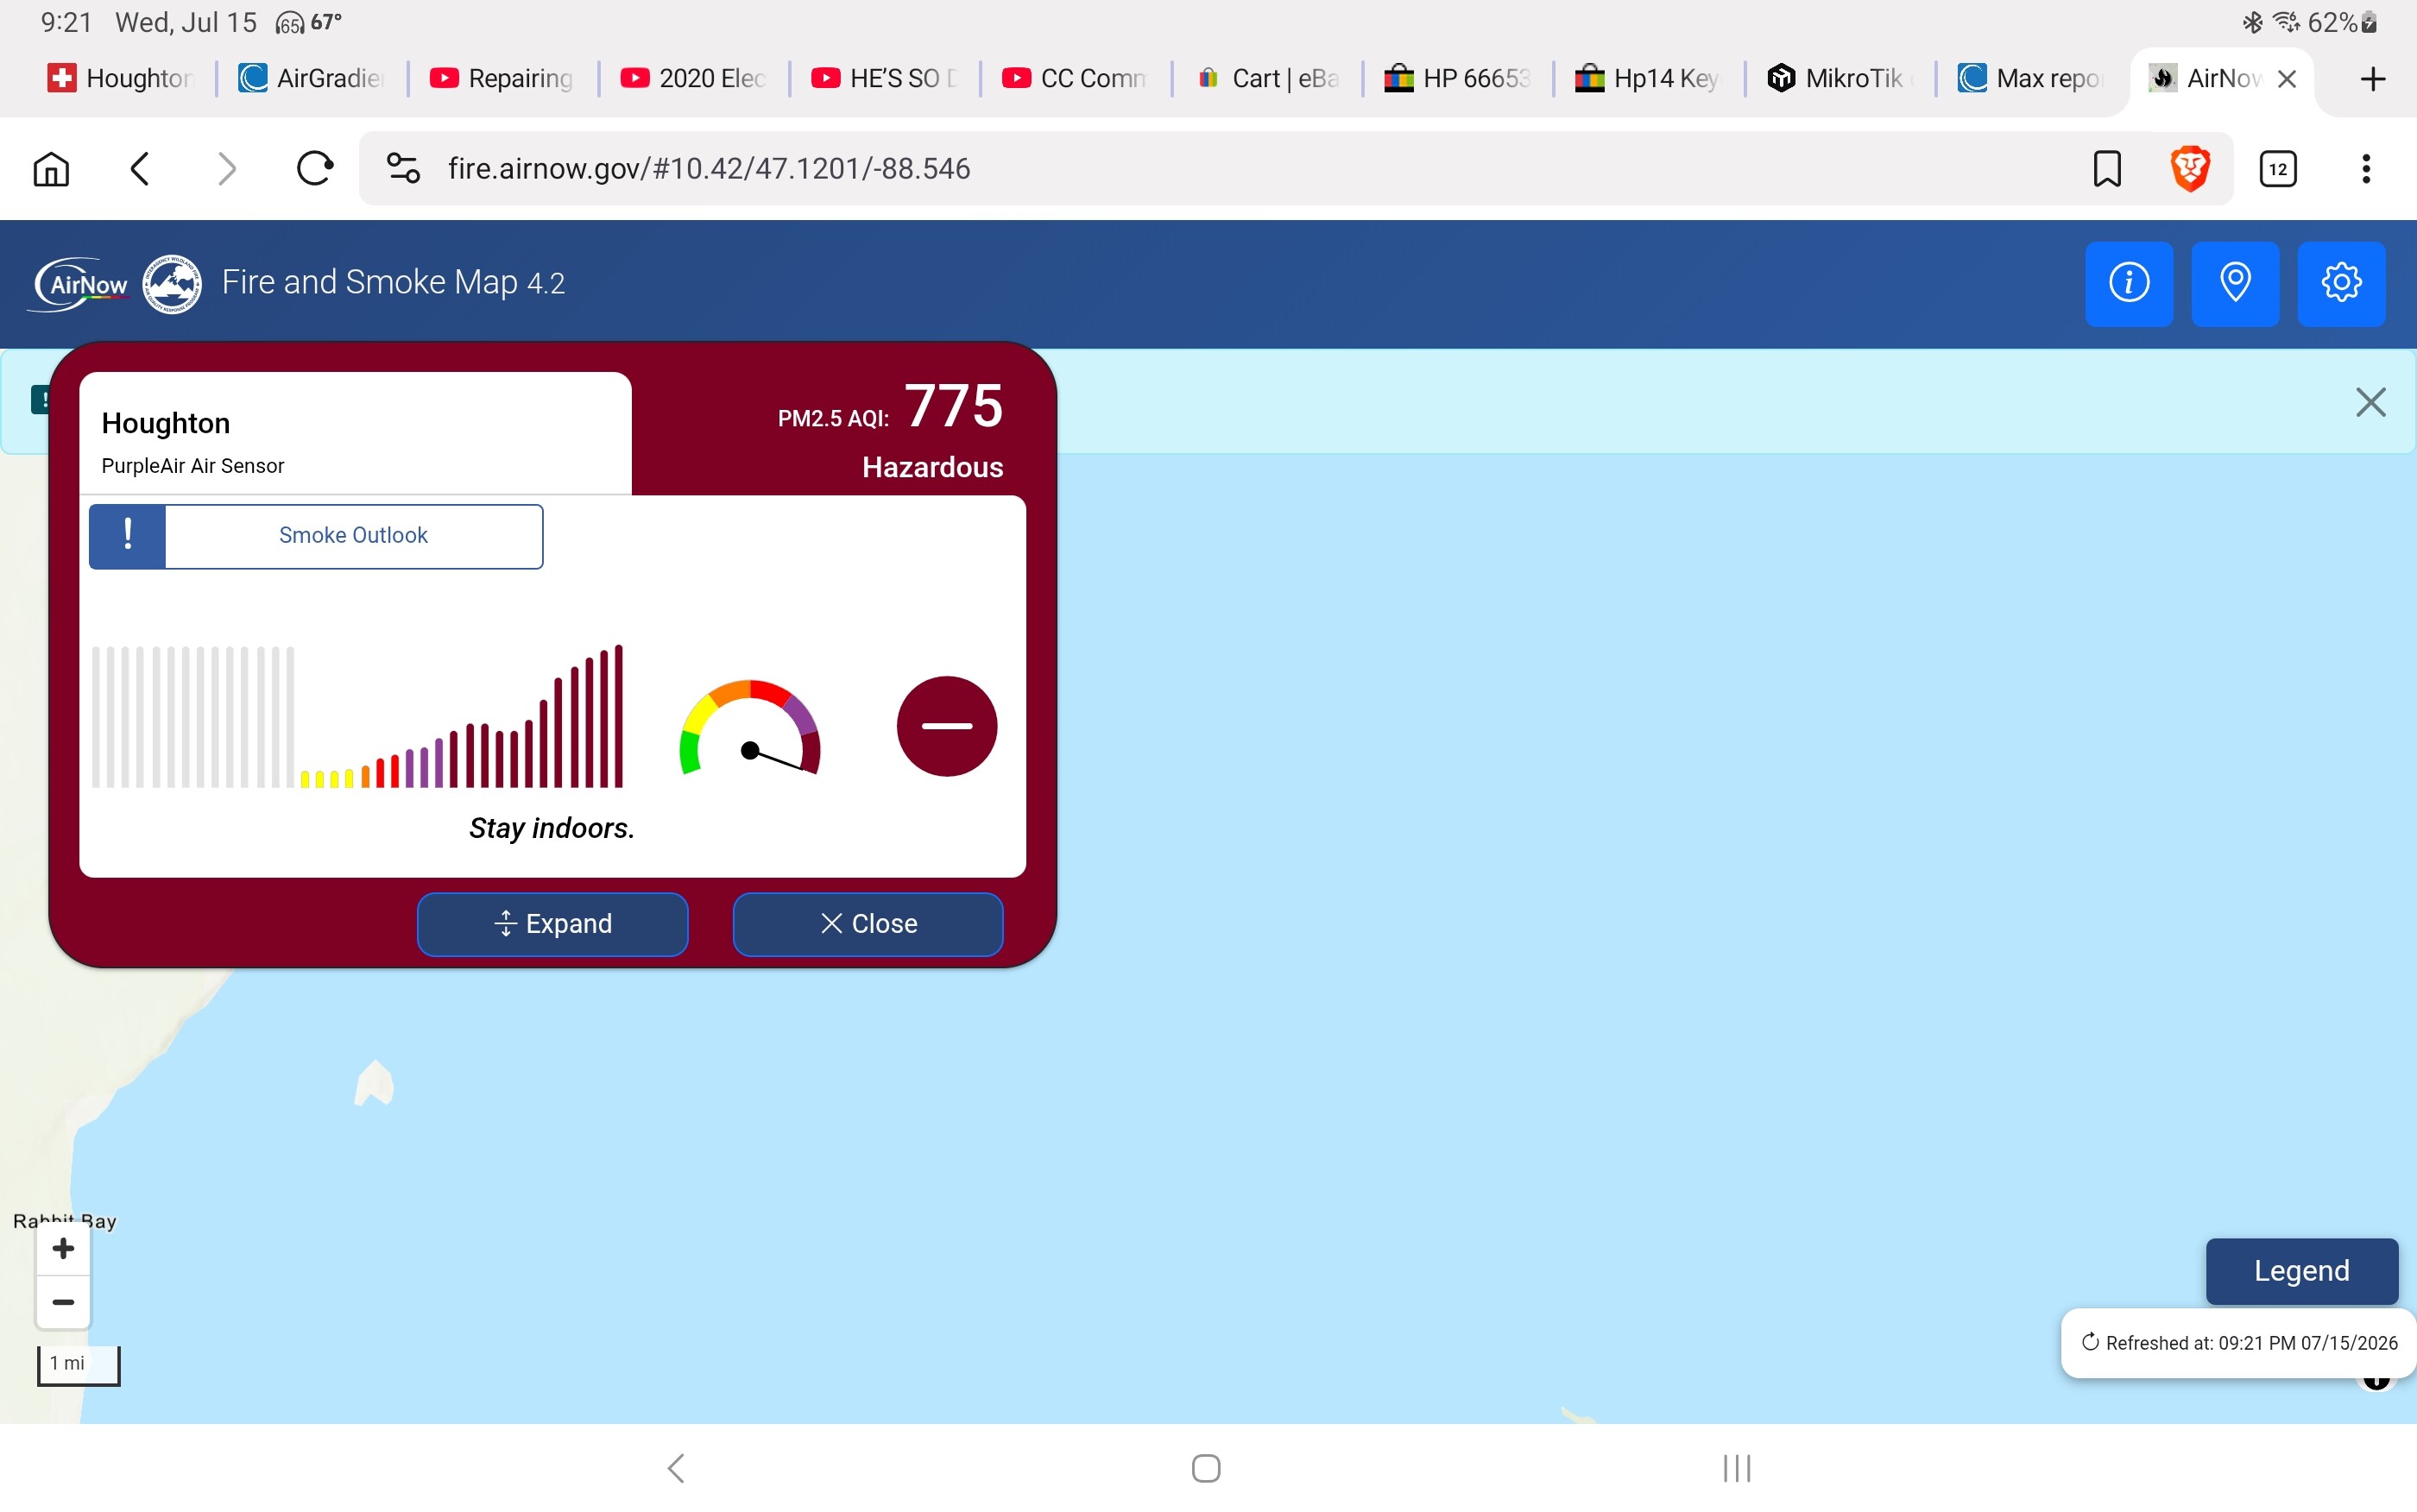
AG def seems to max at 500, but others report far higher:

(The latter being a US EPA related site . . . )

So I doubt that 500 is any form of a “standard” . . . and considering conditionsnhere right now, being off by basically 50% makes the AG data pretty much useless . . .

And now 800 . . . . It’s like living in a chimney! Thanks, Canada! (NOT!)

Hi everyone, thank you for your interesting discussion.

@tadawson, I have been asking my team to check on this.

As far as I am aware, the AirGradient mobile app goes beyond 500 USAQI, so if I understand your context correctly, you monitor the AQI via our web Dashboard, and Map, is that correct?

I will try my best to bring this up with our team and see what we can improve as soon as possible. Please take care.

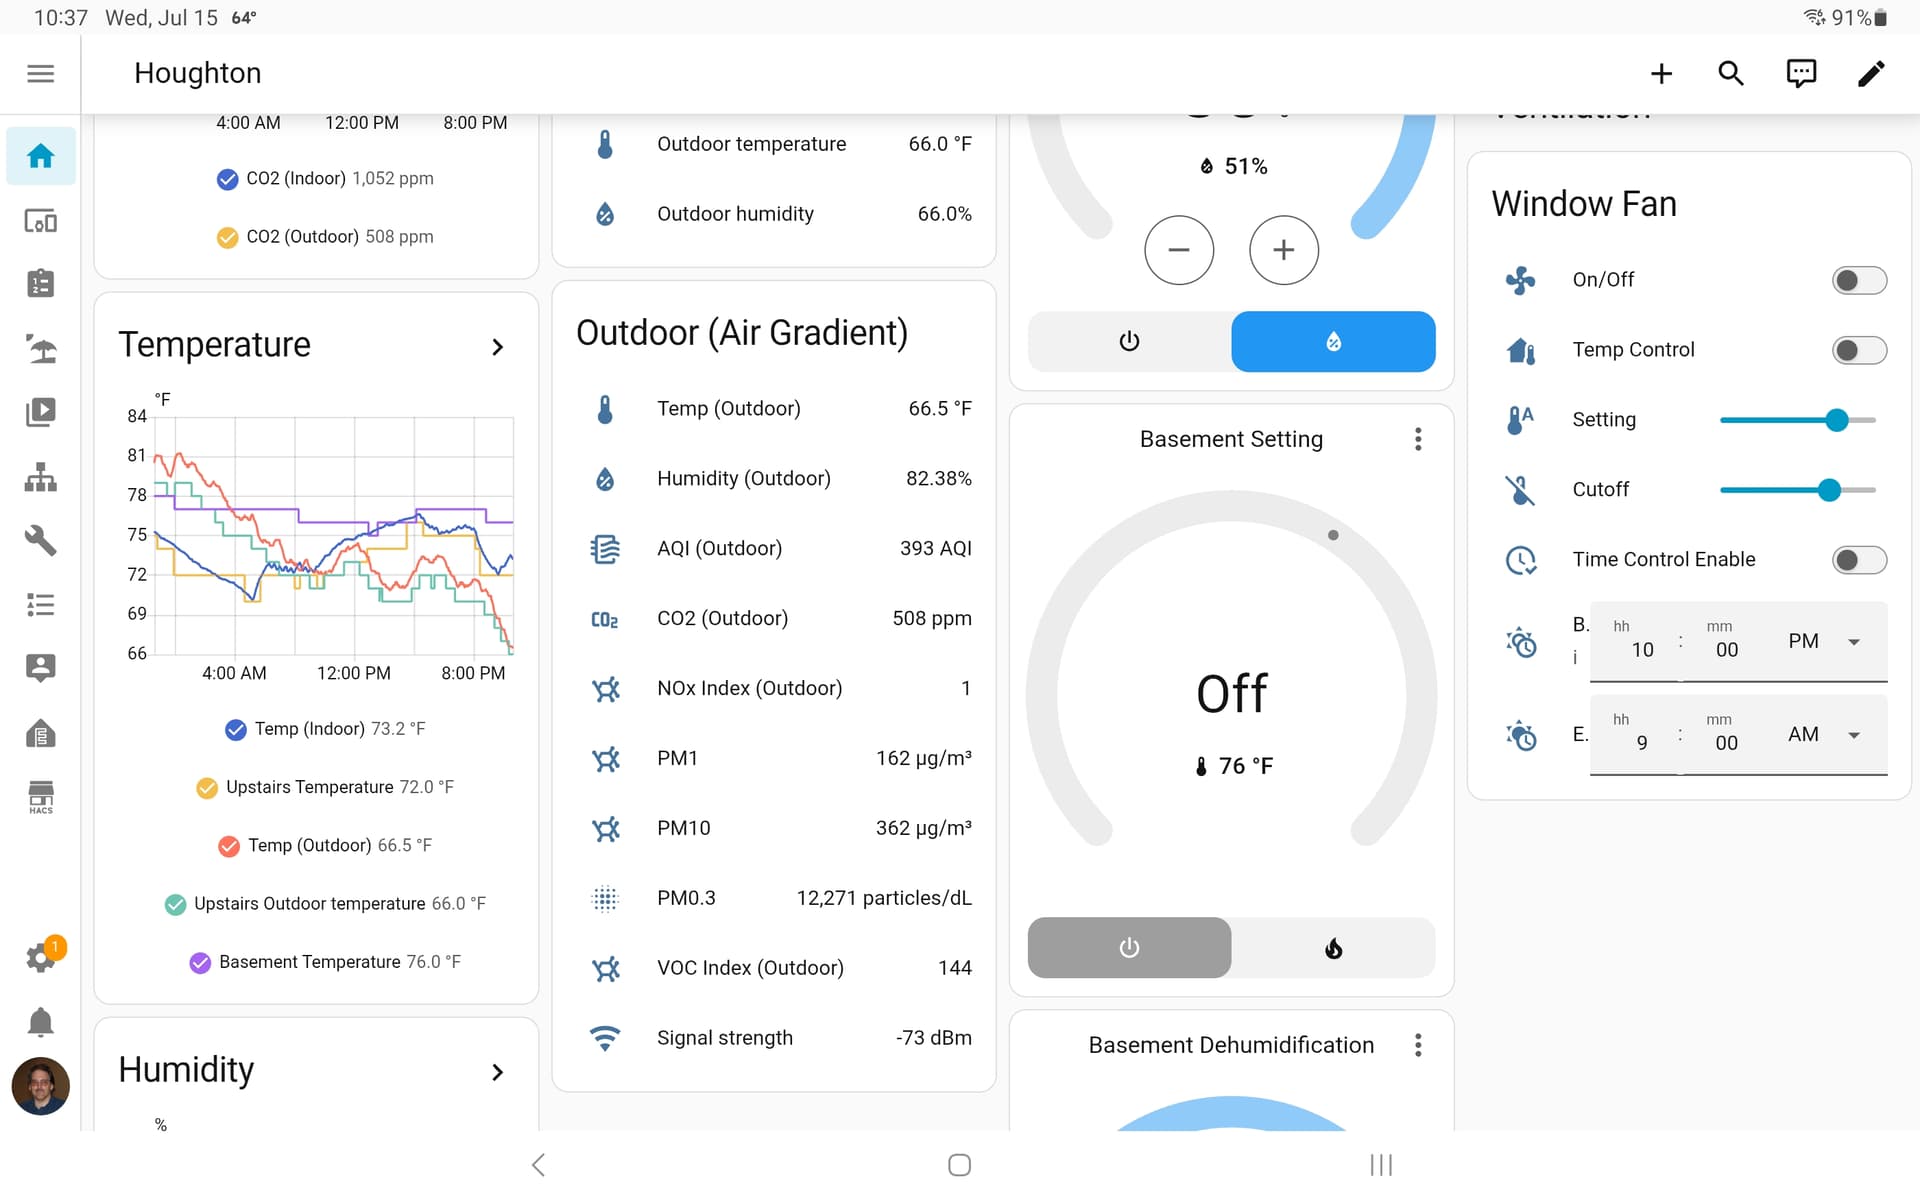
I use the dashboard and Home Assistant. The dash (whe sub 500) tracks other sources pretty well. Home Assistant is showing AQI values half of what is actual (also normally tracks pretty well), so both are errant, but in different ways.

Thanks for the additional info. Our developers have been looking into this. I will let you know as soon as we have an update.

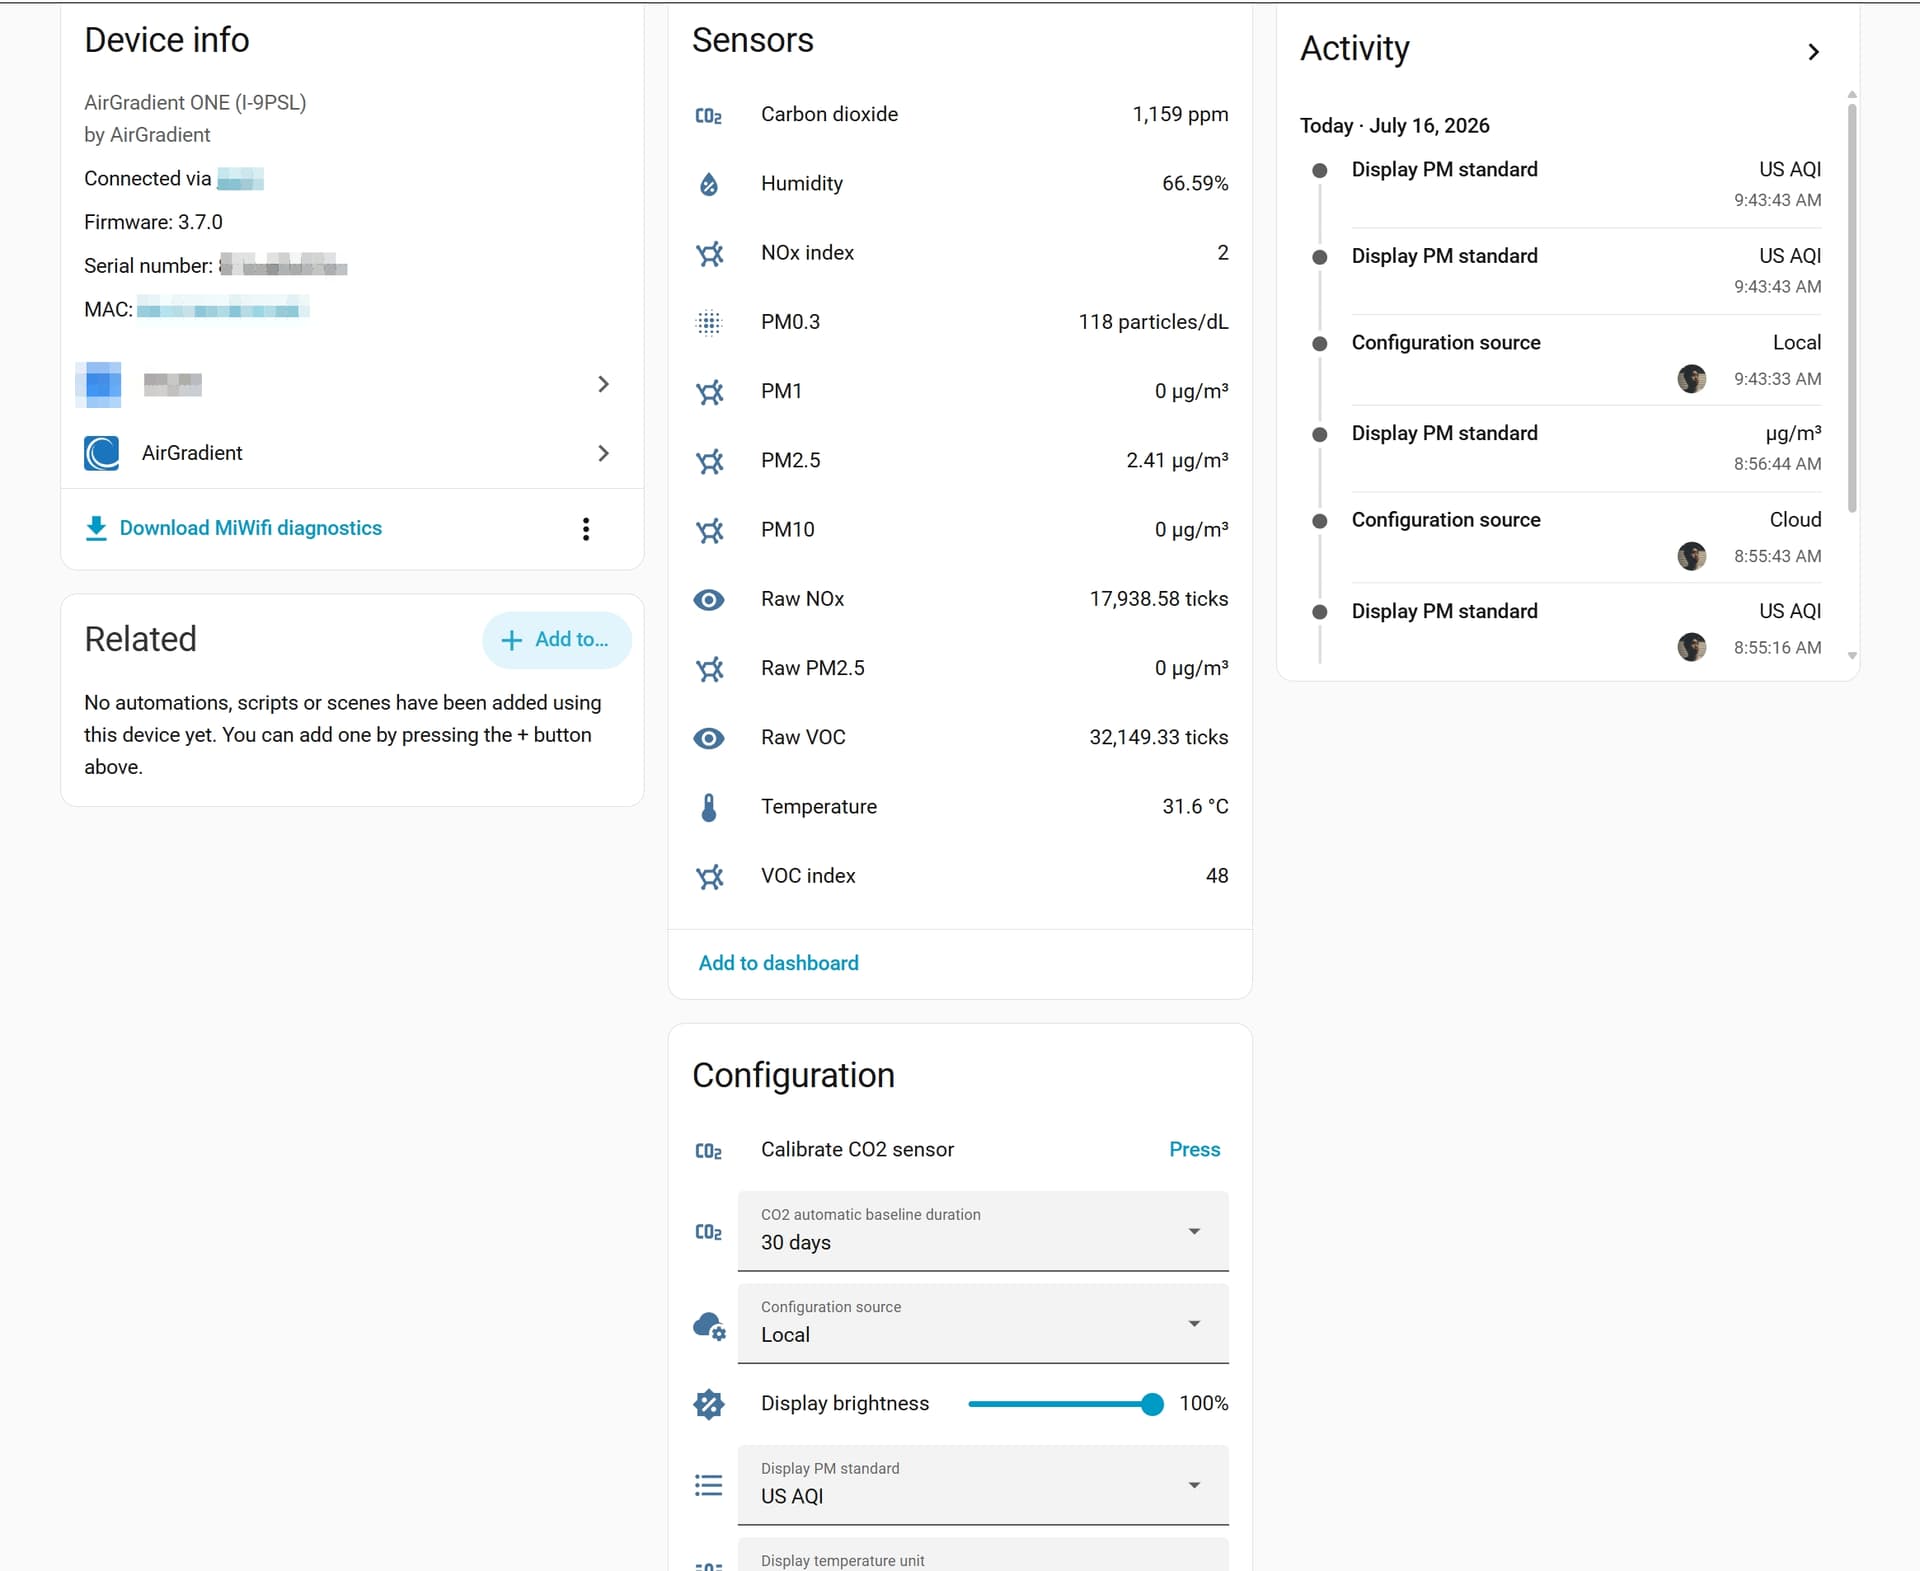
In Home Assistant, the AirGradient integration reports PM in µg/m³ rather than US AQI. To display US AQI on Home Assistant, you can use a sensor template to achieve that. Or you can also take a look at this integration which is quite convenient to use: GitHub - ex-nerd/ha-air-quality-metrics: Air Quality Metrics for Home Assistant · GitHub .

I don’t recall what I did specifically at the moment (frankly, I don’t recall adding anything) but the integration I have (the official one?) appears to directly report AQI:

I note also that the indoor data (same basic block, for my indoor monitor, not in that screen shot) shows AQI of 103, and the AQ dashboard 98 (diff in refresh timing), so it’s def. reporting US AQI directly . . . .

Could that be a Helper in Home Assistant?

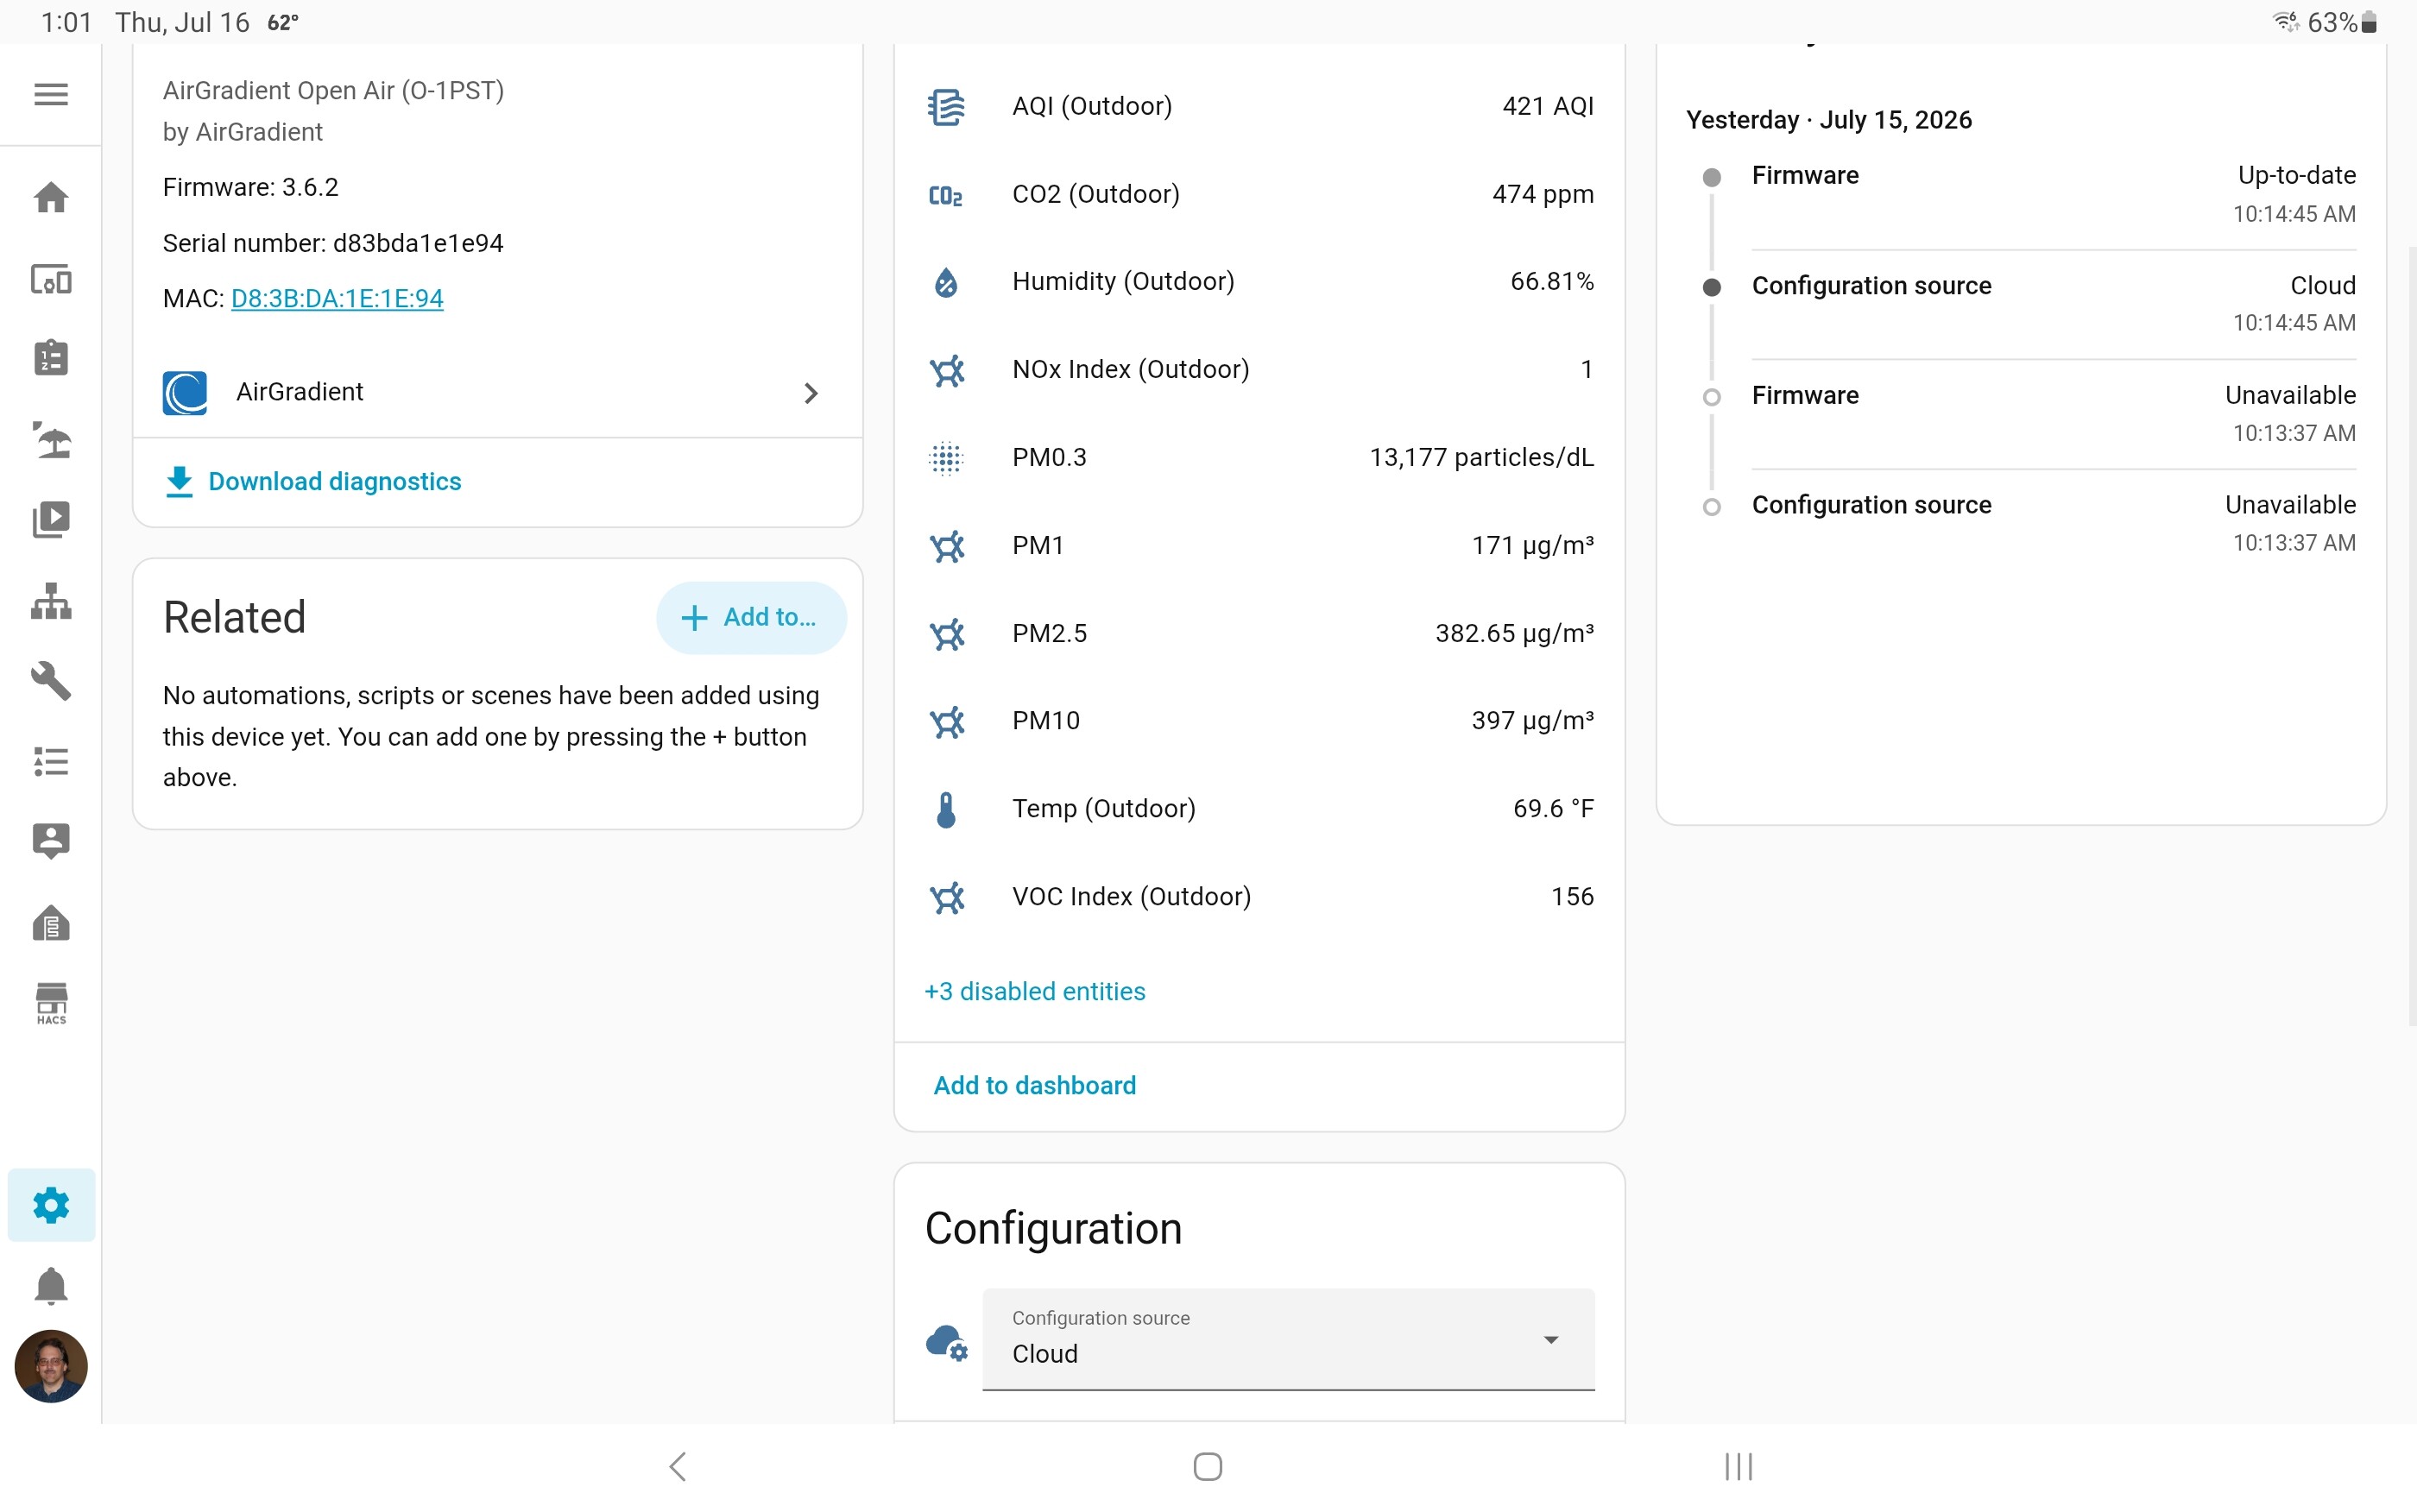
Mine on HA:

1 Like

Found it (it’s,been a while . . . ) def have a helper to bridge this glaring gap in the integration . . .

1 Like

@tadawson Thank you for your feedback. Let me discuss this with our engineer how we should improve the integration. Having it natively shown on the integration could benefit users who prefer AQI.

The far bigger issue is h dash limiiting at a semingly arbitrary max of 500 though . . . (I use both - the dash *and HA simultaneously).

Timely post and precisely the use case why I added an AG outdoor AQ sensor as part a full suite of environmental monitoring sensors. I live in Toronto and yes it appears as of this writing, we’re deep into wild fire season (embarrassingly recorded as the worst major city AQ in the world yesterday! :mask:).

A quick google search also reveals that US-AQI scale caps out at 500. The main take away (even as a data nerd) is don’t get fixated on the data noise and instead act accordingly based on the signal i.e. close windows, avoid strenuous outdoor activity, good excuse to integrate and automate air purifiers, etc.

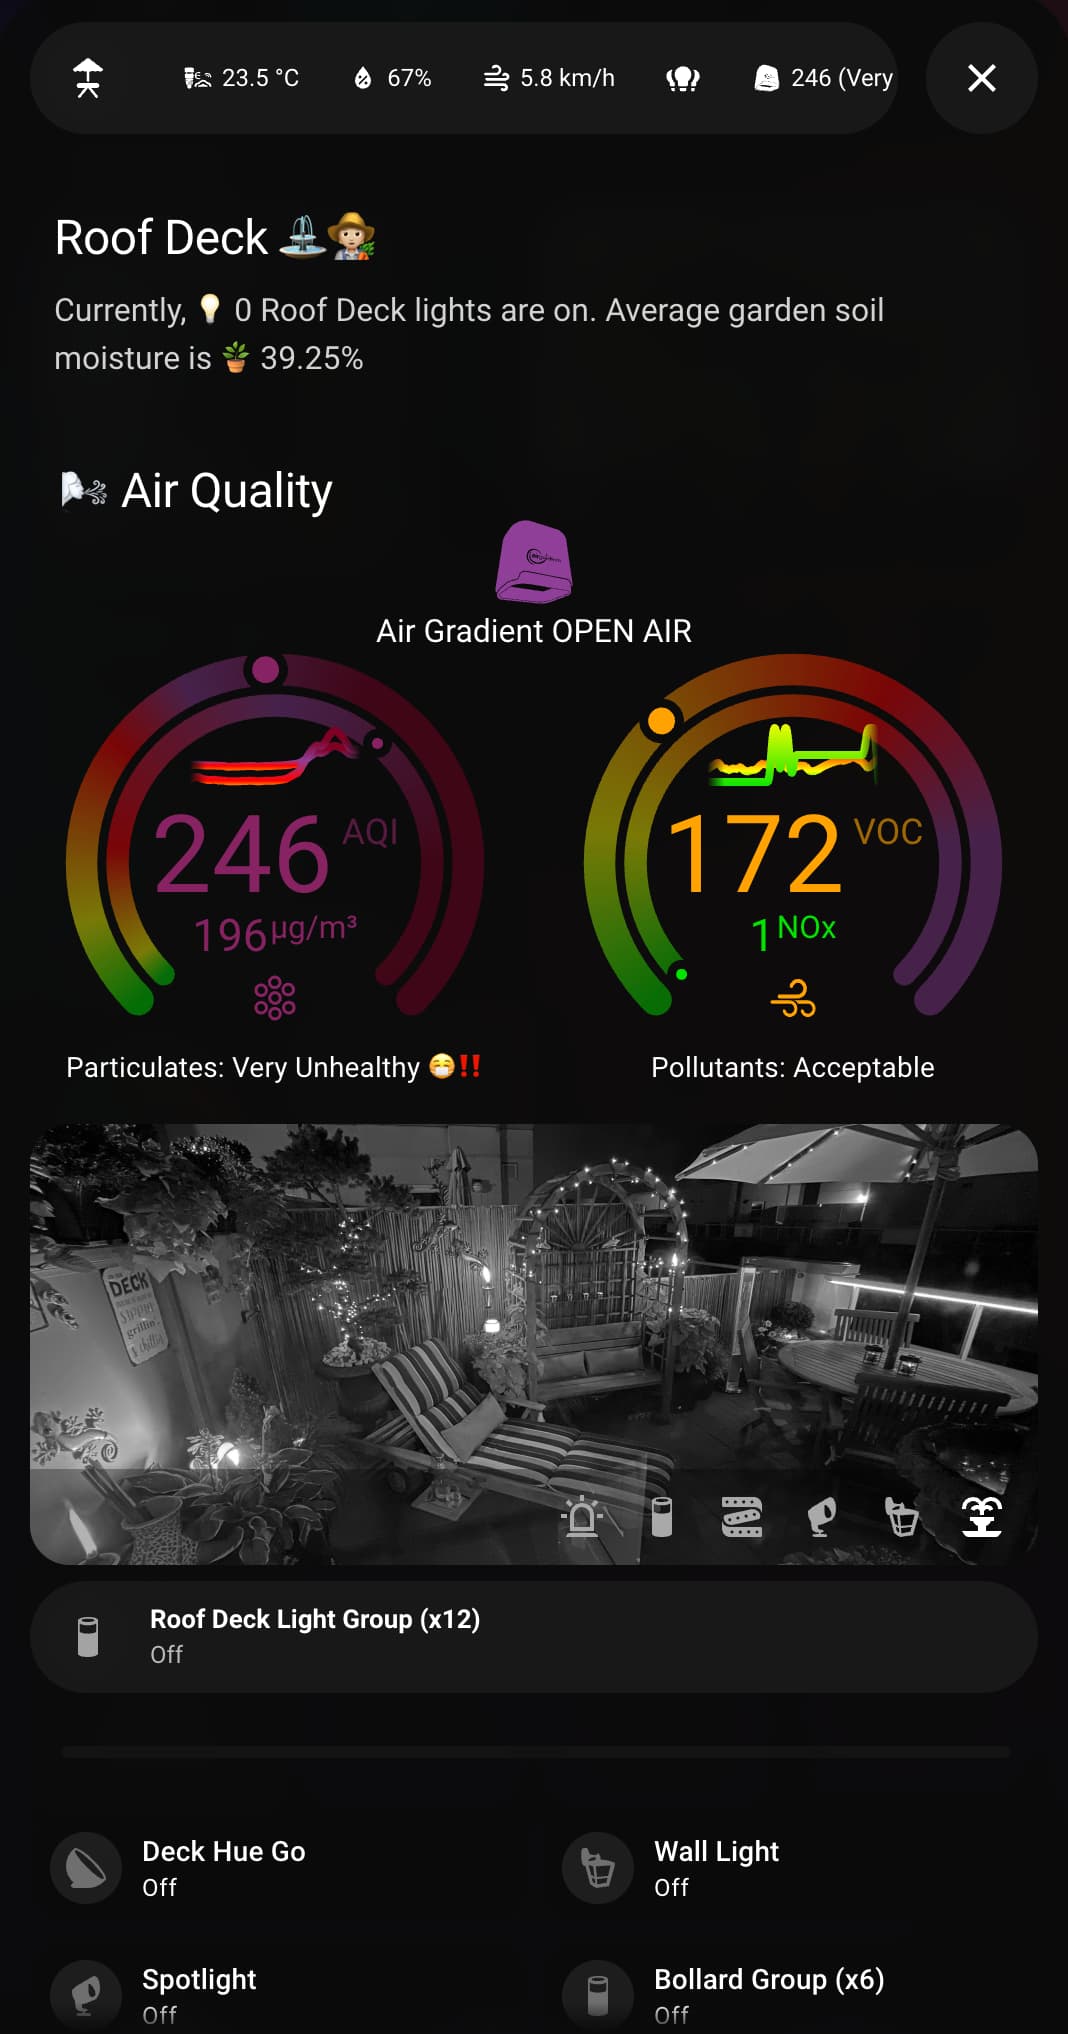
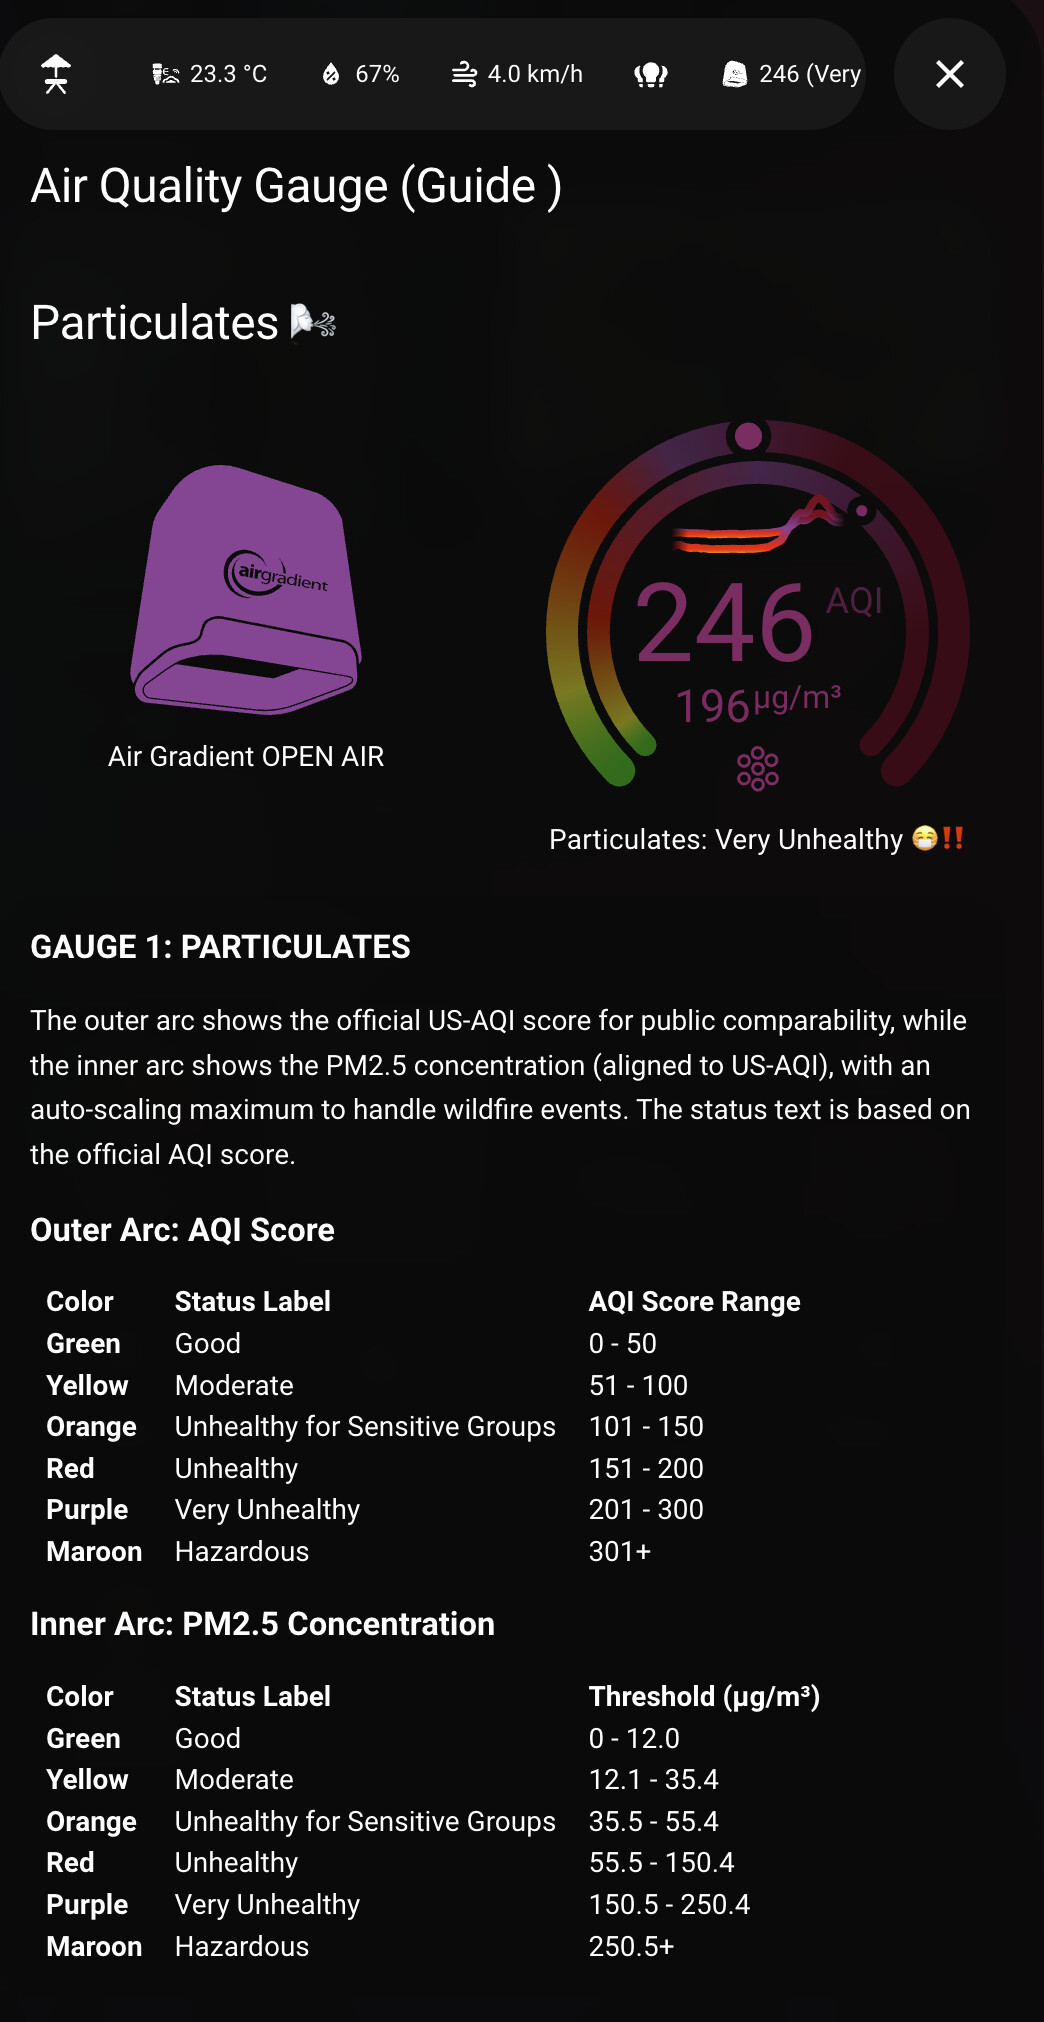
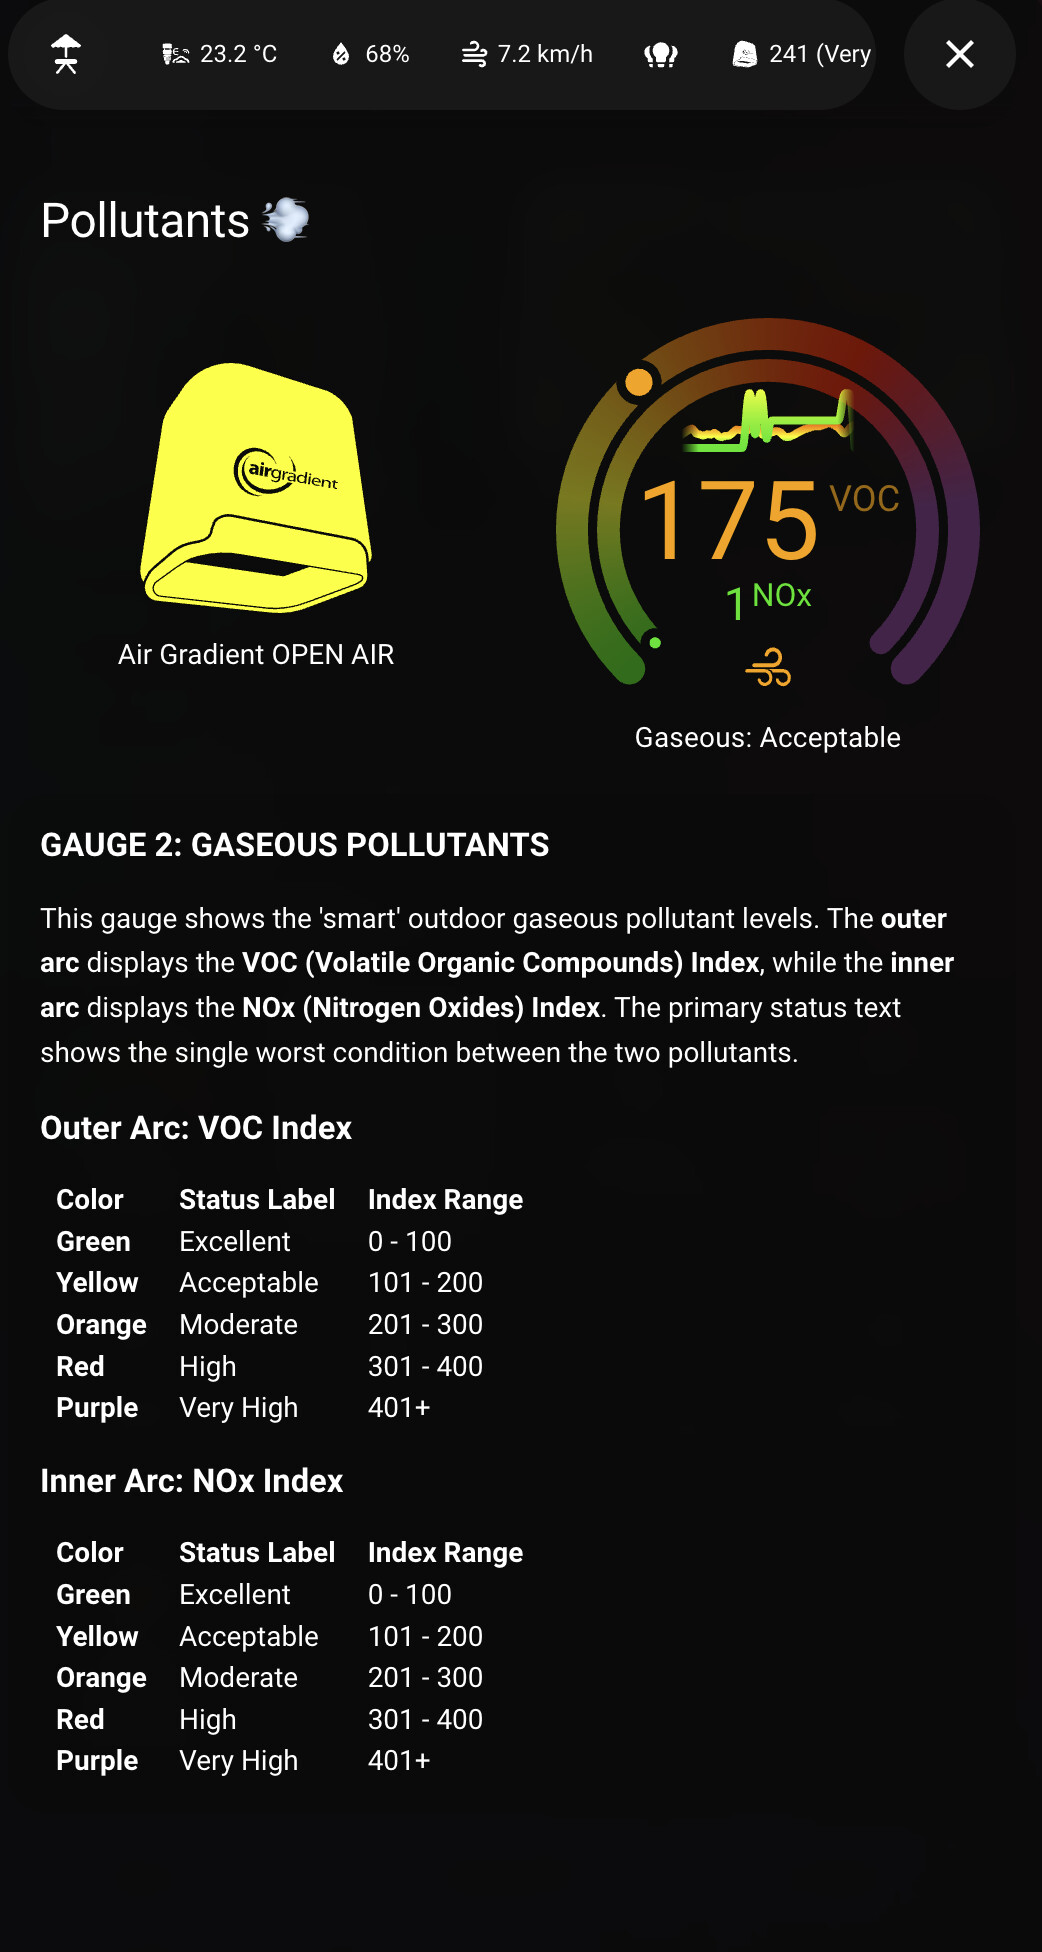
That said, thought I’d share how I integrated the AG outdoor monitor into a dedicated front end mobile and tablet dashboard (bubble card conditional pop-up card) with “human readable status text” aligned to US AQI scaling (color codes & scoring), converting the raw sensor data into simple AQ status e.g. Good, Very Unhealthy, etc. Also included an AQ guide for enhanced UI/UX (with the help of my buddy Claude :robot:).


1 Like

But yet, US EPA based sites (the ones that the AQI scale would have been created by) are reporting well over 500 . . . . Makes no sense, or the 500 limit was either changed or not real. Look as I might, I find zero US sites limiting AQI - just Air Gradient.

1 Like

Sorry to hear that the Canadian wildfires have gotten so bad. I use the AirGradient monitor to see if the air filters are working inside. With windows open and window fans on the PM2.5 levels on AirGradient match the levels from AirVisual (iphone app) at my location. Levels from AirNow (iphone app) are not as helpful. The AirNow levels appear to be averaged over a much longer time. With smoke outside and air filters on inside I can tell if the air filters are working – and to what extent.

IMPORTANT: Do not compare AQI to anything! AQI varies from country to country (particularly China vs US). Also AQI can (according to how it is calculated) take into account many different pollutants not just PM2.5.

IMPORTANT: Use the actual measured values for PM2.5 to compare. Use the values measured in ug/m3 (micrograms per meter cubed). You can see these in the AirVisual app by clicking for more information.

IMPORTANT: The AirGradient monitor cannot calculate AQI, it does not have sensors for all the pollutants that go into the AQI calculation. Of course if PM2.5 overwhelms everything else the the values will be close. Just get used to using the AirGradient PM2.5 in micrograms per meter cubed. That is what your are breathing and what your air filters can reduce.

2 Likes

Note to the AirGradient group. Please DO NOT convert the readings in the AirGradient monitors to some sort of AQI. There is widespread confusion as to what AQI is and how it is measured and calculated (at least I think I am not the only one confused). First, there are many pollutants that go into the AQI calculation, not just PM2.5 (and we are well aware of the limitations of the AirGradient VOC sensor). Second, the conversion of measured values to AQI varies from country to country (differrent algorithms). Third, the time average varies from AQI to AQI (average over 5 minutes, an hour, a day). The AirGradient instantaeous PM2.5 measurements are marvelous (and it is OK to take a short-period average like 5 minutes to smooth out very short-term spikes). Leave it there! No need to add to the AQI confusion.

1 Like

Note to AirGradient group. Of course it would be great if you wanted to really dig-in and uncover the mysteries of the conversion of actual measurements of pollutants to AQI.
(1) Explain in detail how each pollutant is measured and by what devices. Include the normal and excessive ranges for each pollutant and the effects (long-term and short-term) of exposure at various ranges of each pollutant on human health. Some pollutants include: PM2.5, carbon monoxide, nitrogen dioxide, nitrogen monoxide, ozone, sulfur dioxide, PM10.
(2) Explain in detail the various algorithms that are used to calculate AQI (for example US vs China). This would include how each pollutant is weighted in each AQI calculation and why.
(3) Explain in detail the time-average that it used for each of the pollutants in each AQI calculation and why.
(4) Explain the differences and similarities in AQI as reported by the Apple iphone Weather app, AirVisual, AirNow, AccuWeather, Aqicn.org, and how the AQI Calculator at airnow.gov/aqi/aqi-calculator/ fits in with all of this.

I would love to read something that would explain away my confusion and show me how the different AQIs are related to each other.

1 Like

@tadawson Our team is working on the issue you reported (the capped AQI) to align with https://document.airnow.gov/technical-assistance-document-for-the-reporting-of-daily-air-quailty.pdf.

I will let you know when there’s an update. Thank you again for reporting this!

Thank you very much! Typically, we have some of the best air quality in the country, so it was unexpected to see this (today hit an AQI over 1000).

Now that things have cleared somewhat (and have not hit the AG limit), correllations are pretty good:

IQAir: 270
AirNow: 274 (I note that this site calls it’s reading “PM2.5 AQI”, apparently not considering other factors)
My HA Helper: 244
The AG Dashboard: 272

So, overall, my measurements look very good within the current range (and I note no mention of a max in the article you referenced . . . and hopefully we won’t get to a point where that is an issue here again for some time . . . (butthe Canada fires are really bad, and a wind shift will send it right back, unfortunately.)

1 Like