AirGradient Forum

HomeAssistant addon wrong PM values when Airgradient dashboard is OK

Home assistant addon shows wrong values for PM.
Here are the values from Airgradient dashboard, PM2.5 is 14ug/m3


Here are the values from Home assistant addon PM2.5 is 9ug/m3

Here is the log from the device that shows PM2.5 is 14ug/m3:

PM1_AE{1}: 19.67
PM25_AE{1}: 29.67
PM10_AE{1}: 30.67
PM1_SP{1}: 19.67
PM25_SP{1}: 30.00
PM10_SP{1}: 30.67
PM003_PC{1}: 985.00
PM005_PC{1}: 833.50
PM01_PC{1}: 180.67
PM25_PC{1}: 14.03
Temperature{1}: 25.30
Humidity{1}: 29.13

---- PAYLOAD
             {"pm01":9.5,"channels":{"1":{"pm01":19,"pm02":29.67,"pm10":31,"pm01Standard":19,"pm02Standard":30.67,"pm10Standard":31,"pm003Count":1006.5,"pm005Count":857.17,"pm01Count":168.33,"pm02Count":15.33,"atmp":25.3,"atmpCompensated":24.77,"rhum":29.18,"rhumCompensated":44.08,"pm02Compensated":18.78},"2":{"pm01":0,"pm02":0,"pm10":0,"pm01Standard":0,"pm02Standard":0,"pm10Standard":0,"pm003Count":0,"pm005Count":0,"pm01Count":0,"pm02Count":0,"atmp":0,"atmpCompensated":-6.74,"rhum":0,"rhumCompensated":7.34,"pm02Compensated":0}},"pm02":14.80,"pm10":15.5,"pm01Standard":9.5,"pm02Standard":15.33,"pm10Standard":15.5,"pm003Count":503.25,"pm005Count":428.58,"pm01Count":84.17,"pm02Count":7.67,"atmp":12.65,"atmpCompensated":9.83,"rhum":14.59,"rhumCompensated":25.71,"pm02Compensated":9.39,"tvocIndex":102.75,"tvocRaw":30877.92,"noxIndex":1,"noxRaw":16994,"boot":7,"bootCount":7,"wifi":-51,"serialno":"aaaaaaa","firmware":"3.1.21-snap","model":"O-1PPT"} 
                                                      -----

Looks like Airgradient dashboard shows correct values (the same as in the device log) when Home assistant addon shows wrong values. All data and screenshots are taken at the same time. Sure that can be because HomeAssistant addon pulls data slowly, but even after 15 minute the data in the addon are still the same.

HomeAssistant is pulling from the local API as near as I can tell. And you seem to be correct, in my testing over the past 8 hours here I can concur that the values in the App do not match the values from the local API.

I’m not sure why this would be. Comparing pm02Comensated locally to PM2.5 in the app should report the same value, unless I have a fundamental misunderstanding.

I think this just may be an artifact of sample rate though, I don’t think there’s an actual problem to be “fixed”. I am sampling every 1 minute, whereas the App is sampling every 5. I don’t think the app does any averaging or anything, it’s just reading the raw data at a point in time, as am I.

If I am correct, then the data in HomeAssistant in your graph is just from a slightly differant point in time than what is reported in the app.

Does not look like that it is just a simple delay or scrapping interval difference.
I’ve been waiting 15 minutes to see the update Home Assistant values to 14ug/m3, but that does not happen. It was regularly updated but within 8-9ug/m3 (HA shows the datetime of the update, so you know it is not previous old value)
At the same time if you check the device log it shows correct values (updated every several seconds) with no 8-9ug/m3 for pm2.5, the same as in the dashboard.
It looks like a mixing up between PM1 and PM2.5 because of if you swap them then everything looks OK as in the dashboard

Here, I’m digging into this more right now because you’ve gotten me curious
The device itself seems to update every 2/3 seconds. Values which are returned vary pretty wildly between them, which is probably not unexpected for a relatively inexepsive sensor.

I’m using this to find out. Every second for 30 seconds I am polling the API and printing the timestamp.

for i in {1..30}; do echo "$(date '+%Y-%m-%d %H:%M:%S') pm02Compensated: $(curl -s http://10.69.10.92/measures/current | jq -r '.pm02Compensated')"; sleep 1; done

Here, I am using my nicotine vape to trigger it. I am blowing it at the sensor from about 3 or 4 feet away. Do you see what I mean now?

root@prod[~]# for i in {1..30}; do echo "$(date '+%Y-%m-%d %H:%M:%S') pm02Compensated: $(curl -s http://10.69.10.92/measures/current | jq -r '.pm02Compensated')"; sleep 1; done
2025-02-09 10:57:39 pm02Compensated: 4.81
2025-02-09 10:57:40 pm02Compensated: 3.93
2025-02-09 10:57:41 pm02Compensated: 3.93
2025-02-09 10:57:42 pm02Compensated: 3.32
2025-02-09 10:57:44 pm02Compensated: 3.32
2025-02-09 10:57:45 pm02Compensated: 3.32
2025-02-09 10:57:46 pm02Compensated: 2.98
2025-02-09 10:57:47 pm02Compensated: 2.98
2025-02-09 10:57:48 pm02Compensated: 2.98
2025-02-09 10:57:50 pm02Compensated: 5.95
2025-02-09 10:57:51 pm02Compensated: 5.95
2025-02-09 10:57:52 pm02Compensated: 5.94
2025-02-09 10:57:53 pm02Compensated: 33.93
2025-02-09 10:57:55 pm02Compensated: 33.93
2025-02-09 10:57:56 pm02Compensated: 96.73
2025-02-09 10:57:57 pm02Compensated: 96.73
2025-02-09 10:57:58 pm02Compensated: 96.65
2025-02-09 10:58:00 pm02Compensated: 210.83
2025-02-09 10:58:01 pm02Compensated: 210.83
2025-02-09 10:58:02 pm02Compensated: 210.83
2025-02-09 10:58:03 pm02Compensated: 423.2
2025-02-09 10:58:05 pm02Compensated: 423.2
2025-02-09 10:58:06 pm02Compensated: 423.2
2025-02-09 10:58:07 pm02Compensated: 423.2
2025-02-09 10:58:08 pm02Compensated: 703.69
2025-02-09 10:58:10 pm02Compensated: 703.69
2025-02-09 10:58:11 pm02Compensated: 703.69
2025-02-09 10:58:12 pm02Compensated: 1121.43
2025-02-09 10:58:13 pm02Compensated: 1121.43
2025-02-09 10:58:14 pm02Compensated: 1121.43

@Samuel_AirGradient Can you/your developers take a look at this when you have a moment?

I double checked that. The values are constantly different. When Dashboard has 15ug/m3 HA addon has 8ug/m3 and this happens all the time, here is the graph of logged values, does not look like a delay or scrapping interval difference.

Screenshot_2025-02-09_17-41-07

Right, and if you notice the dots in your graph never line up exactly. When readings can change from second to second, there will be differences.

You also might not be comparing apples-apples in those two graphs. One is likely a compensated value with the EPA curve applied, where the other can be raw data.

Look here so you can see what I mean, the API exposes 3 differant values for PM 2.5, each with a differant compensation curve.

My point is there’s more than one problem.

1 Like

Hi @den ,

I think the configuration between the cloud and local on device is different, could you make sure of that? Please see corrections and configurationControl from /config local request then compare corrections applied on advanced setting of your monitor on airgradient dashboard.

Here is the log from the device that shows PM2.5 is 14ug/m3:

pm02 field from the payload is raw data, pm02Compensated is the corrected data. HA takes PM2.5 value from the correction field.

Hi @nickf1227 ,

It’s interesting what you do here! Maybe we can discuss in this forum since it’s more about integration issue.

On the firmware side, there’s actually smoothing happening on the device itself and its using moving average with different interval for each measurements type (see here). Also, local API and send data to airgradient server is basically calling the same function.

So for @den case, value on airgradient dashboard and homeassistant should be more or less the same. But sure, again it depends on how quick changes in our environment and firmware send data to airgradient server is not at the same time with HA pulling data, even though both do that in interval of 60s.

The local API server should always be the source of truth for data at a quantum in time, and it should not be smoothed.

I understand your point above from other thread and i would love to hear your proposal in this. Because at the end of the day, as long as " multiple client" pull data at a different time interval, it would never have the exact same value. I know that is a hot take, but of course it depends.

Sure!

Ah Interesting!
I do not think the existing values represent data which is bad. The point of my PR going into the integration side was that the PM data returns differant values very fast. For integrations like HomeAssistant, we do not need highly accurate numbers that end up rapidly changing. A sawtooth looking graph is bad for this specific application. However, it may be desirable in others.

Here we see in a ~1 minute period that PM has dramatically changed.

2025-02-09 13:08:01 pm02Compensated: 948.89
2025-02-09 13:08:04 pm02Compensated: 1136.21
2025-02-09 13:08:07 pm02Compensated: 1264.21
2025-02-09 13:08:10 pm02Compensated: 1334.69
2025-02-09 13:08:13 pm02Compensated: 1279.43
2025-02-09 13:08:16 pm02Compensated: 1087.97
2025-02-09 13:08:20 pm02Compensated: 980.06
2025-02-09 13:08:23 pm02Compensated: 771.77
2025-02-09 13:08:26 pm02Compensated: 681.78
2025-02-09 13:08:29 pm02Compensated: 526.86
2025-02-09 13:08:32 pm02Compensated: 459.74
2025-02-09 13:08:35 pm02Compensated: 340.83
2025-02-09 13:08:38 pm02Compensated: 293.2
2025-02-09 13:08:41 pm02Compensated: 200.2
2025-02-09 13:08:44 pm02Compensated: 162.82
2025-02-09 13:08:47 pm02Compensated: 123.25
2025-02-09 13:08:50 pm02Compensated: 107.01
2025-02-09 13:08:53 pm02Compensated: 81.47
2025-02-09 13:08:56 pm02Compensated: 62.87
2025-02-09 13:08:59 pm02Compensated: 55.92

Setting automation in Home Asssitant with this data would be challenging. The average here of this one minute of sample data is ~730 ppm. But if you look, by the end of that 1 minute time frame, PM has already recovered, all on its own!

Lets say I have a fan set to turn on when PM goes over 100.

If I used any of the numbers before, say 2025-02-09 13:08:53, I would have turned a fan on, which at the end of the next 1 Minute interval, would just turn back off. Duty cycling fans like this will dramatically increase wear and is bad!

My point is, sampling should be tailored for each specific integration. Even more smoothing in the firmware wouldn’t solve the problem, and would make other applications potentially worse off.

The only “in firmware” solution would be to expose a new value pm02CompensatedAveraged over the API that has a longer rolling average. But I’m not sure you would even have enough memory for this if you have to do it for multiple sensor readings! Memory is a lot “cheaper” when you are solving the problem externally without living in an arduino :joy:

Aaandd then you’re f***ing with the schema, confusing people, and potentially breaking integrations that already exist! We already have 3 seperate flippin pm02 values! How many is enough?! :crazy_face:

See this question:

@Samuel_AirGradient
This is how I am now doing this for my Grafana integration

Heres two examples.

This top one uses the methodology I started using this afternoon.

Every 60 seconds is a collection period. I will query the API 12 times, 3 seconds apart. So I have 12 data points in 36 seconds of data for every collection period. There is 24 seconds between the end of a collection period, and the start of the next one.
I throw out the highest and lowest value the API returns in the collection period as “outliers”. I average the remaining 10. I have a handler for a null or “-” value returning, and need at least 3 valid samples to return any data to the csv. I am rounding to the hudredths place.

This is 5 minute example with the new sampling approach. I get an absolute reading of around 200 for the “non compensated” data line, and around 100 for the “copensated” one. It’s also obviously “rounder”.

This example from earlier today before I implemented the above changes. This methodology is much more simple, I am just querying the API once every 60s and writing it to a file.
I get an absolute value of about 600 for the “non compensated” data line and around 400 for the “compensated” one.

While not perfectly apples-to-apples, the same action is triggering it. I am vaping a nictoine pen and blowing it at the AirGradient. I am sitting in roughly the same place and the sensor has not moved.

I also hope you enjoy the irony of the fact I am a nicotine fiend and I care about air quality. :crazy_face:

2025-02-09 13:08:01 pm02Compensated: 948.89
2025-02-09 13:08:04 pm02Compensated: 1136.21
2025-02-09 13:08:07 pm02Compensated: 1264.21
2025-02-09 13:08:10 pm02Compensated: 1334.69
2025-02-09 13:08:13 pm02Compensated: 1279.43
2025-02-09 13:08:16 pm02Compensated: 1087.97
2025-02-09 13:08:20 pm02Compensated: 980.06
2025-02-09 13:08:23 pm02Compensated: 771.77
2025-02-09 13:08:26 pm02Compensated: 681.78
2025-02-09 13:08:29 pm02Compensated: 526.86
2025-02-09 13:08:32 pm02Compensated: 459.74
2025-02-09 13:08:35 pm02Compensated: 340.83
2025-02-09 13:08:38 pm02Compensated: 293.2
2025-02-09 13:08:41 pm02Compensated: 200.2
2025-02-09 13:08:44 pm02Compensated: 162.82
2025-02-09 13:08:47 pm02Compensated: 123.25
2025-02-09 13:08:50 pm02Compensated: 107.01
2025-02-09 13:08:53 pm02Compensated: 81.47
2025-02-09 13:08:56 pm02Compensated: 62.87
2025-02-09 13:08:59 pm02Compensated: 55.92

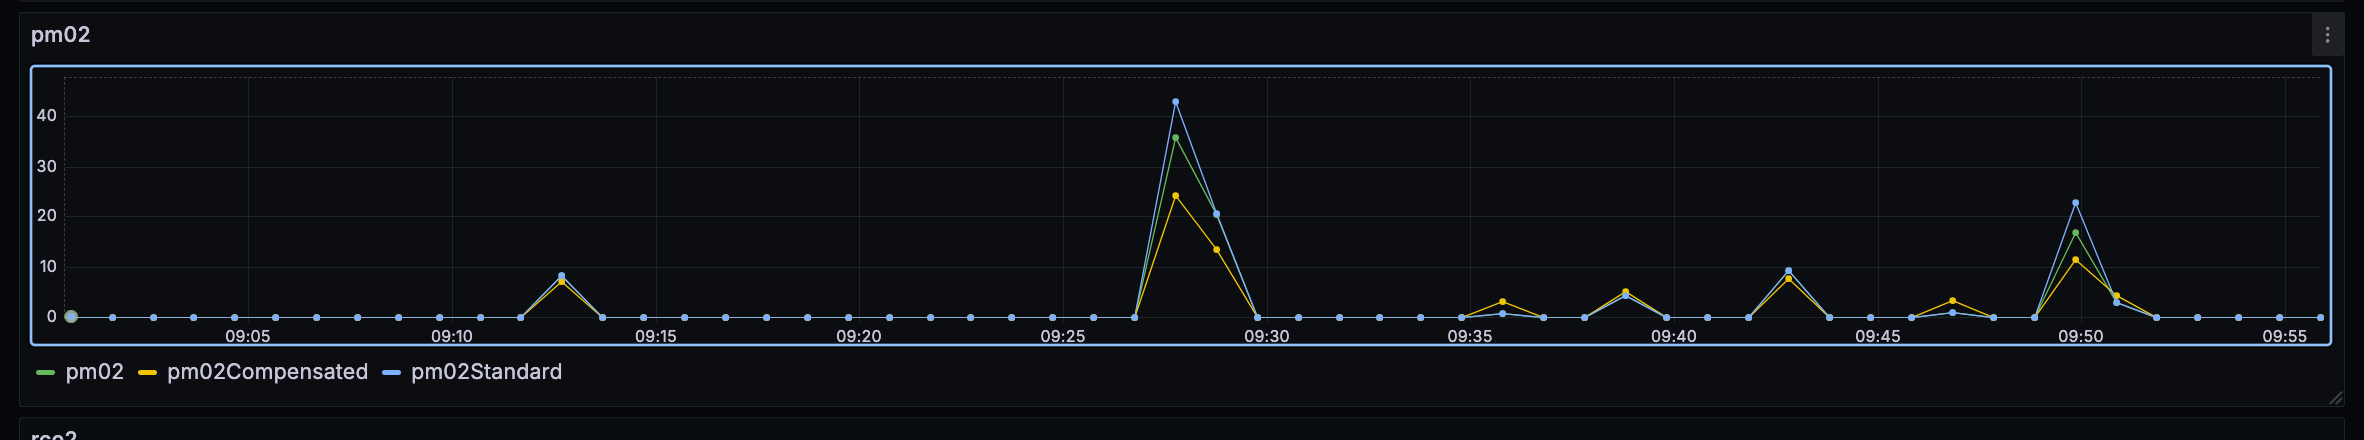
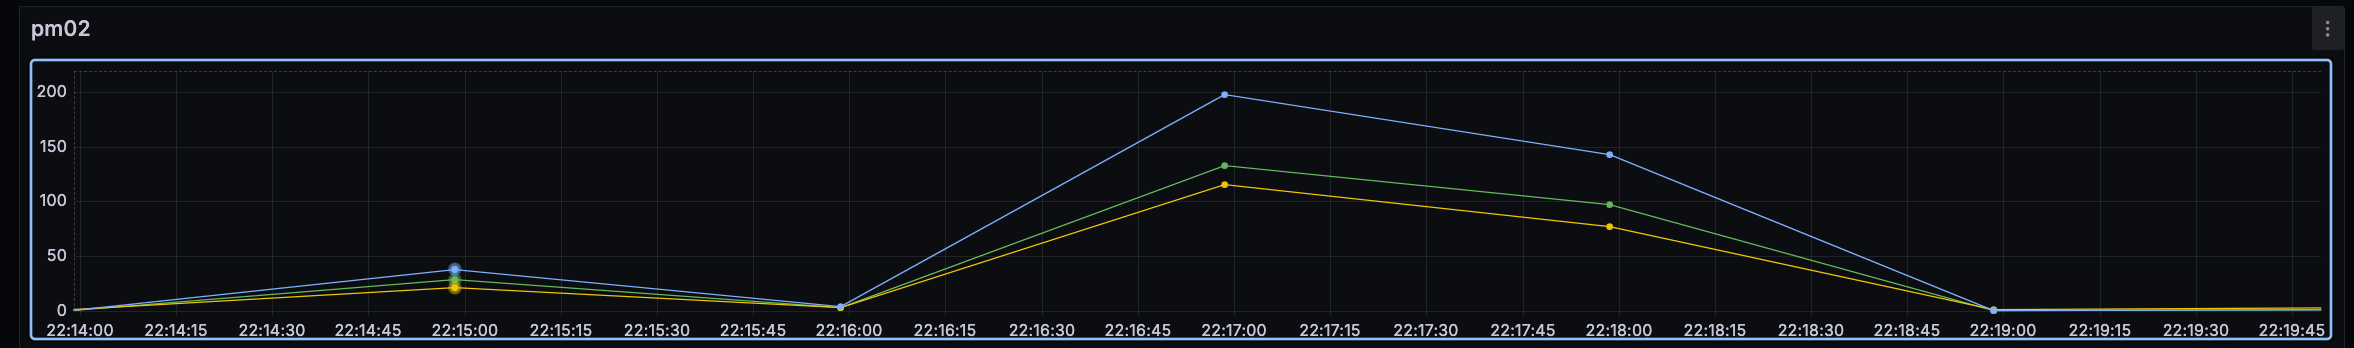
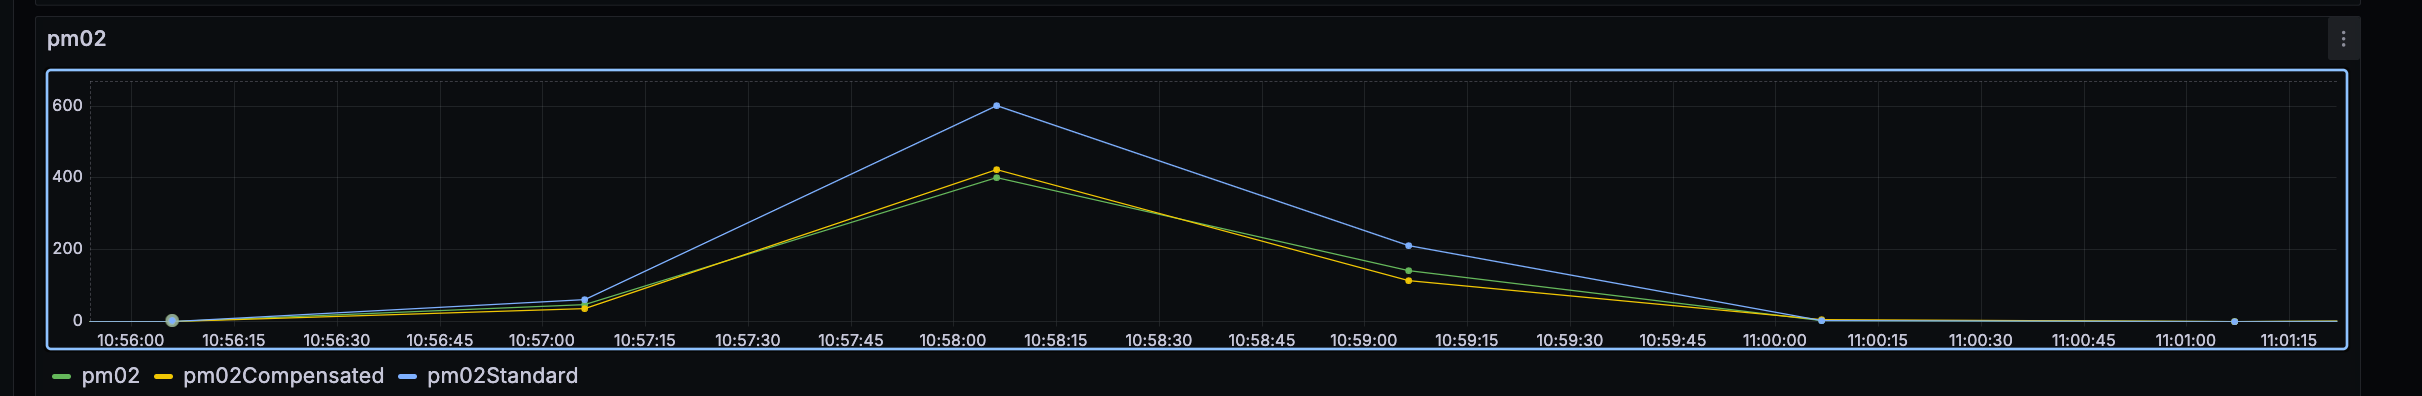
And just to make sure my point is clear and concise. These are “micro bursts”. It is a feature that, in its current form, we can detect them…not a bug. I would be sad if you guys chose to smooth out the data even more at the firmware level.

For my usecase, however, I just do not need to know that they are happening. That’s why I think its best to handle this externally, where my usecase is defined.

Also I just need to say how much I respect you guys. If I am understanding this correctly…We are talking about a device that shoots a laser beam at a wall and extrapolates the volumetric density of microscopic particles based on how much light is blocked. And this device costs less than 20 dollars. Its a wonder it works at all.
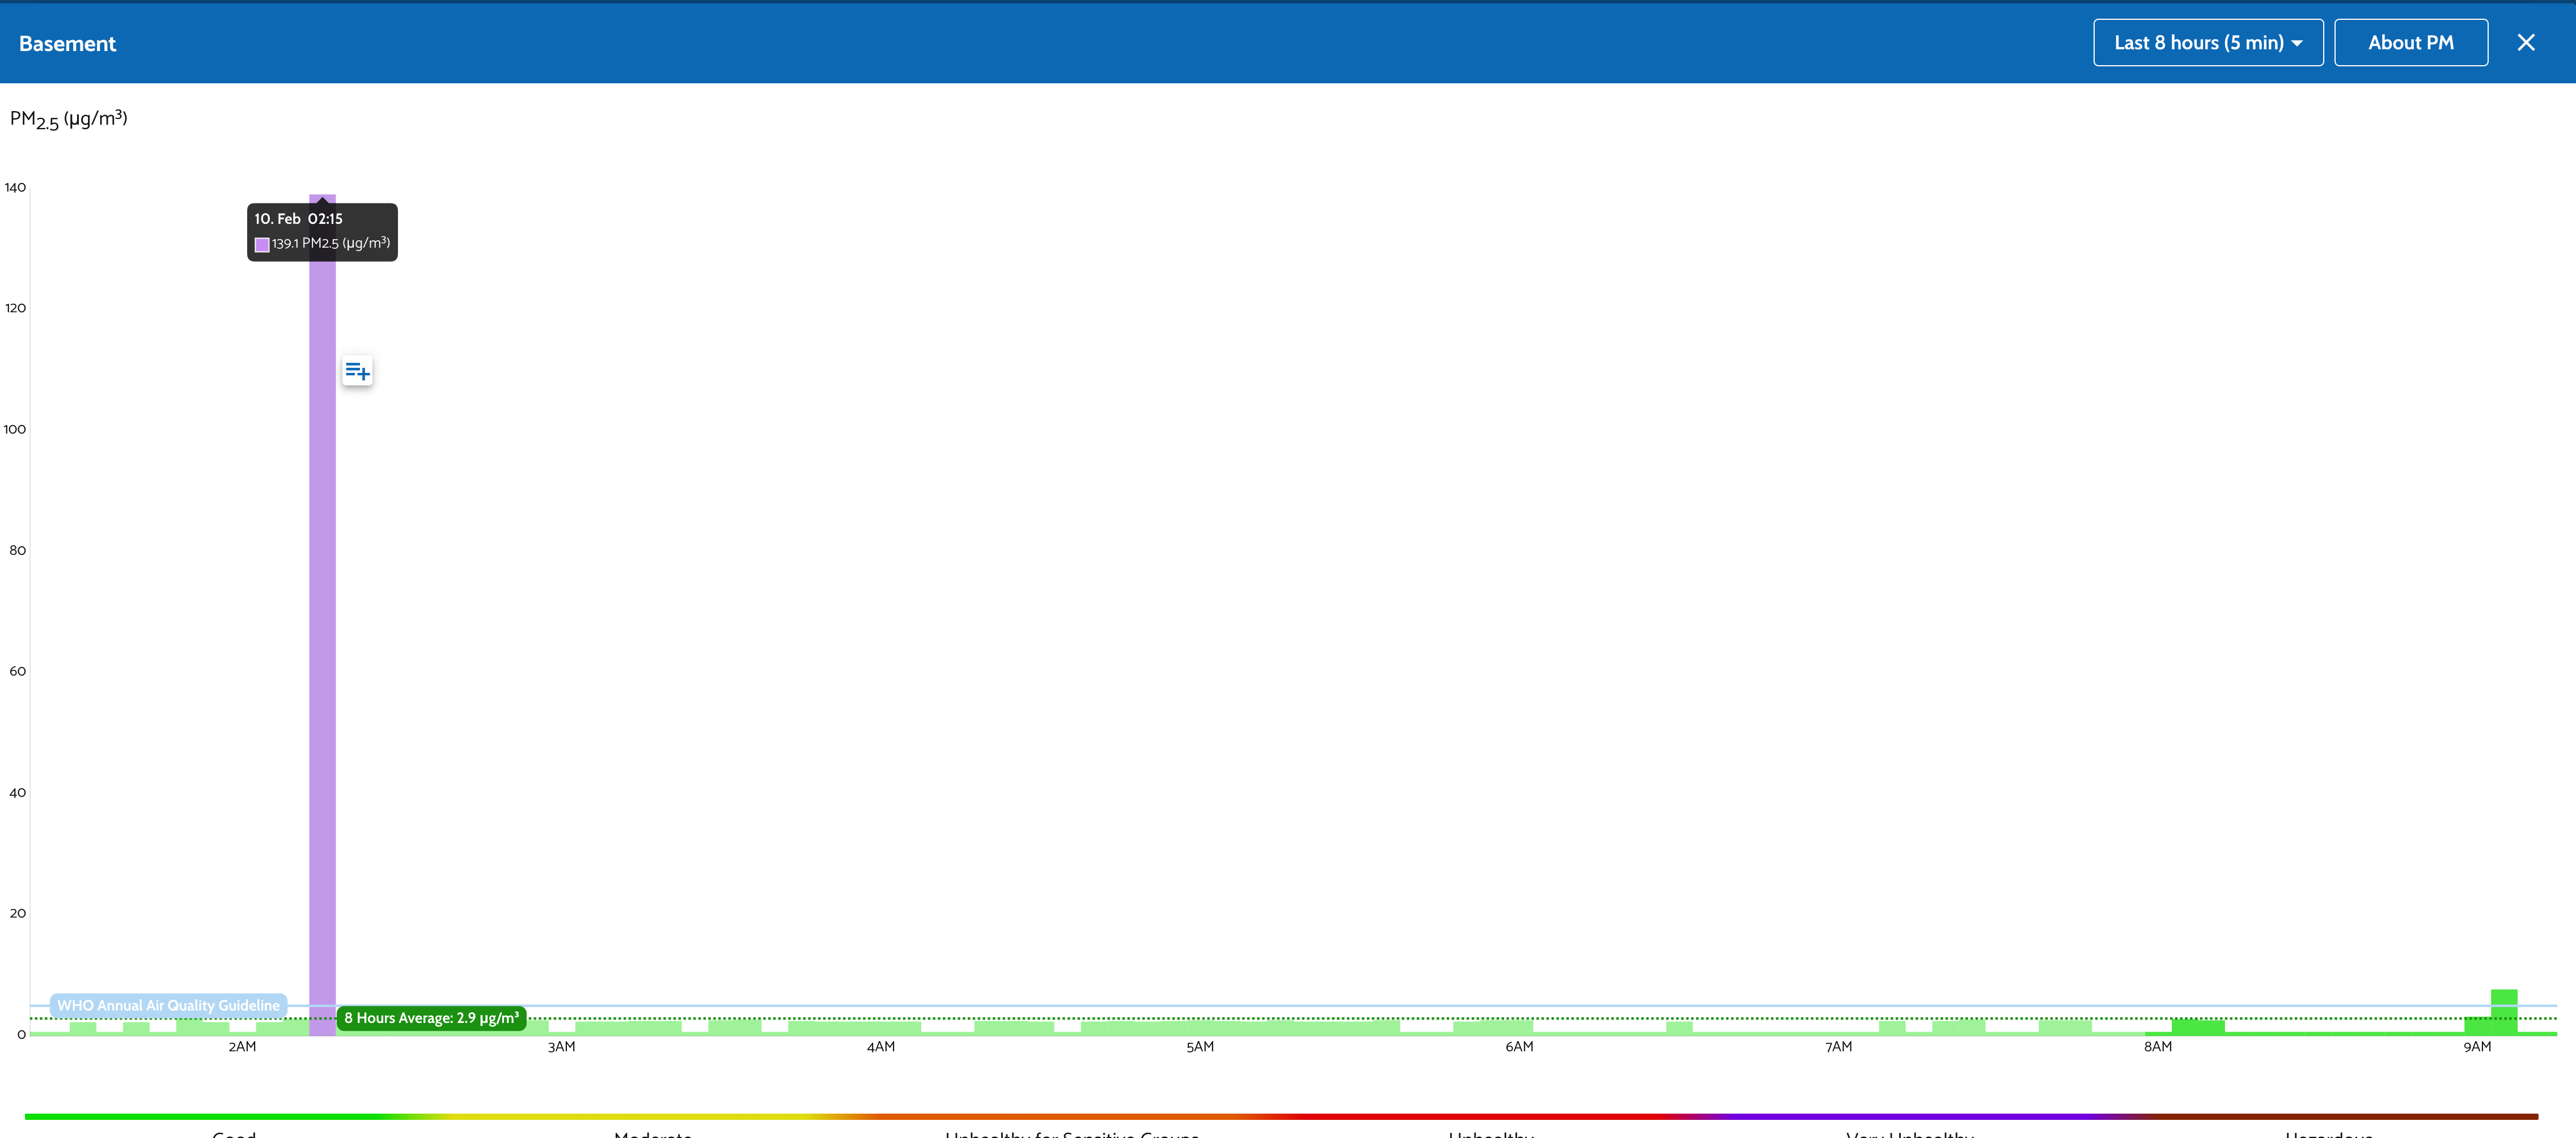
EDIT
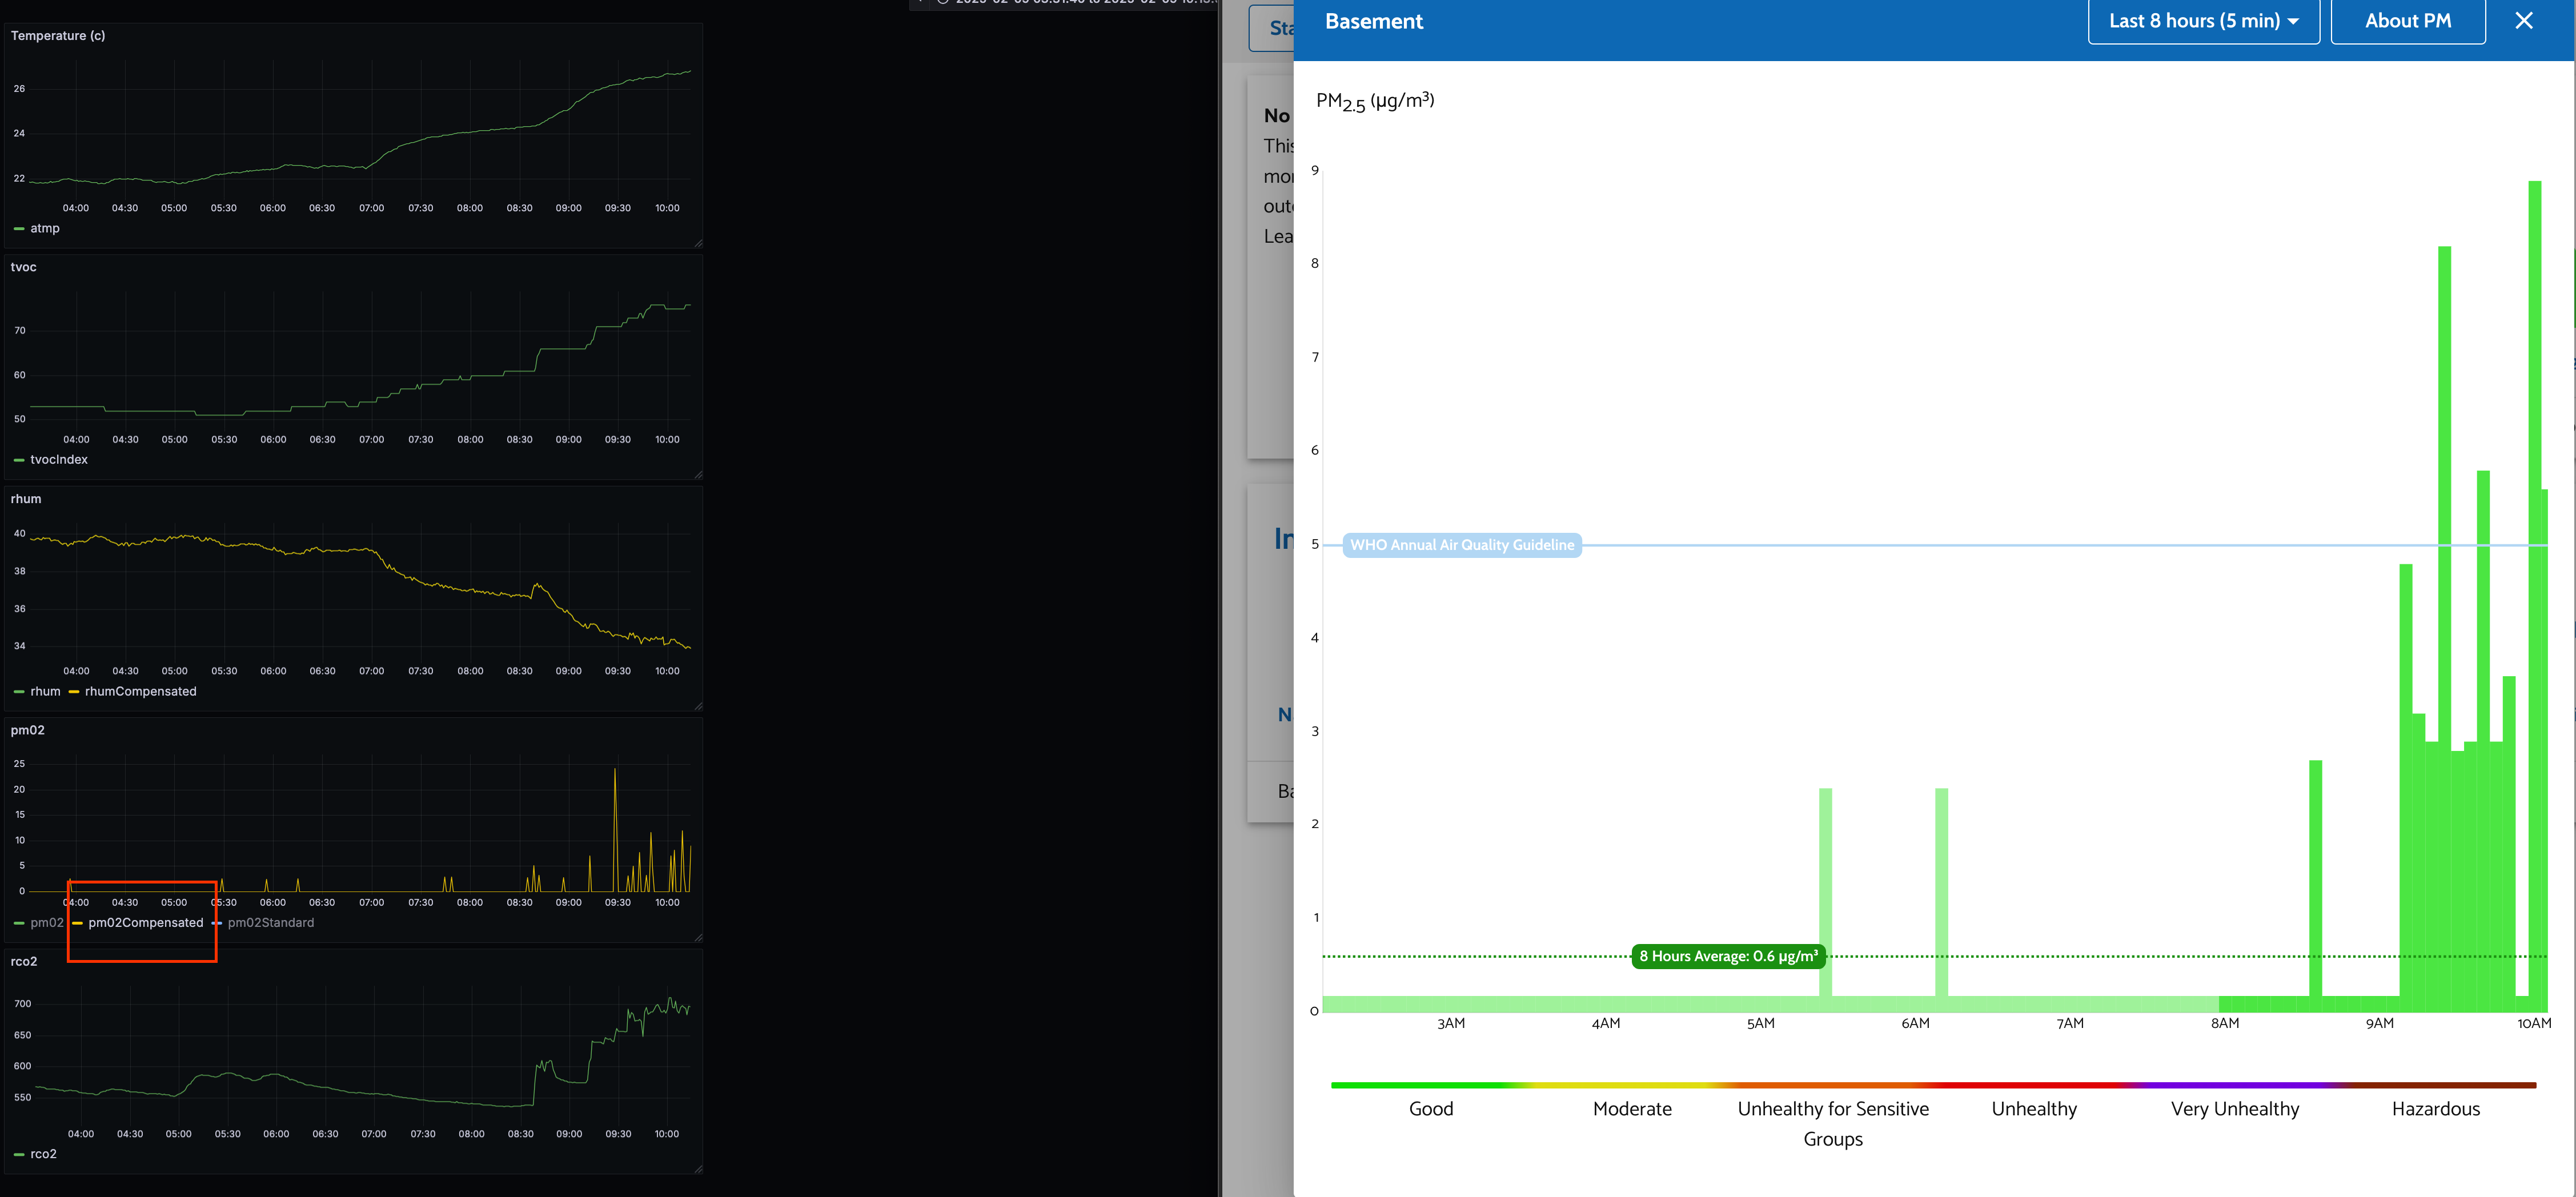
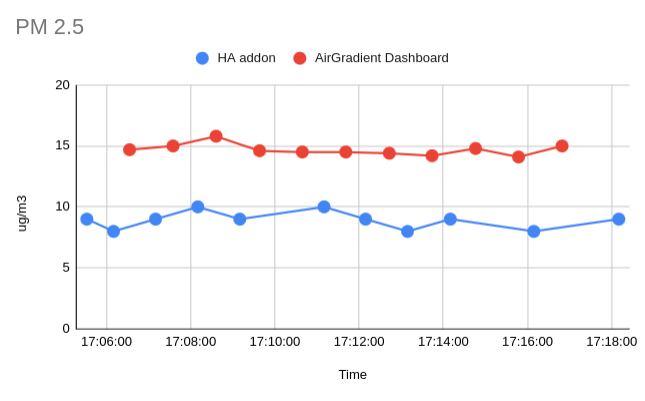
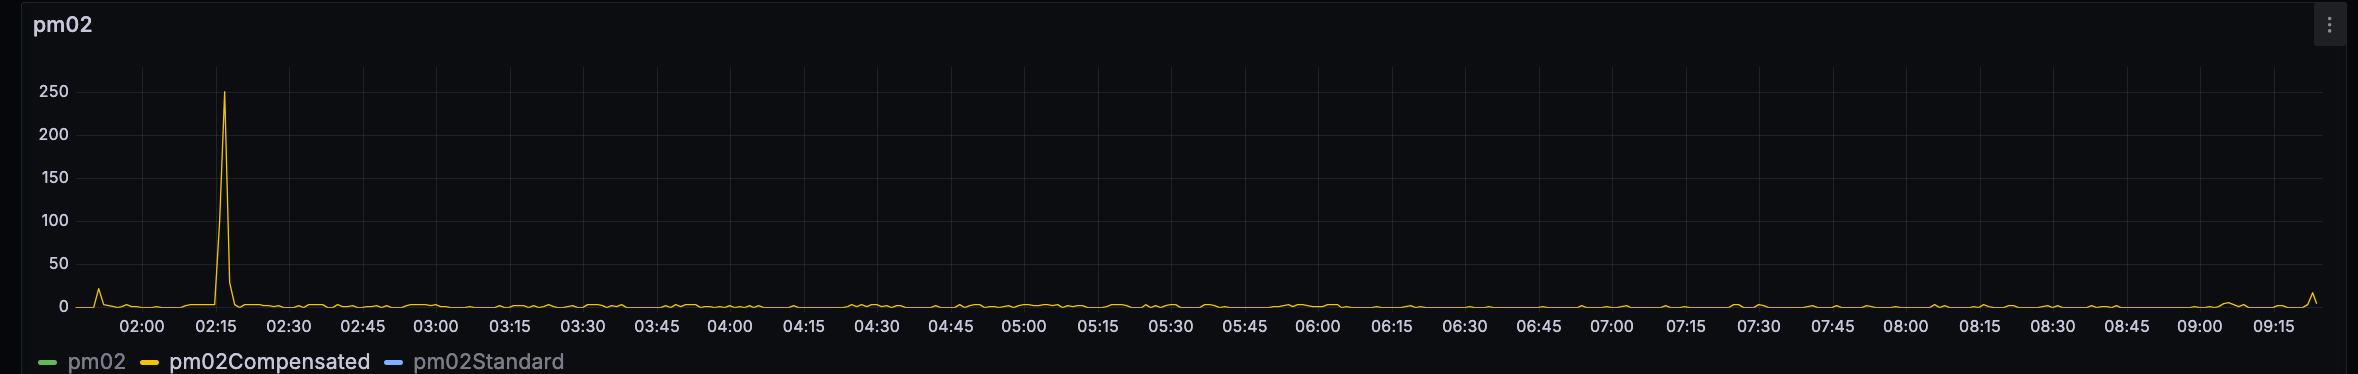
It seems the AirGradient Dashboard is applying even more smoothing than I am, probably as a result of the differing sample times and sample rates, but I’m not sure.
It gives me a value of 140 whereas I am getting a value of 250. This does not mean good things for HomeAssistant users.

Added some debugging for now to make sure I’m not wrong. Math seems to all check out

=== DEBUG: pm02Compensated Samples and Calculation ===
Collected Samples (Timestamp and Value):
  2025-02-10T09:40:28.102332: 2.83
  2025-02-10T09:40:31.135864: 4.93
  2025-02-10T09:40:34.204736: 14.1
  2025-02-10T09:40:37.284114: 28.86
  2025-02-10T09:40:40.352671: 89.91
  2025-02-10T09:40:43.454977: 128.16
  2025-02-10T09:40:46.493462: 256.44
  2025-02-10T09:40:49.566585: 319.75
  2025-02-10T09:40:52.585304: 415.06
  2025-02-10T09:40:55.718626: 444.41
  2025-02-10T09:40:58.778988: 461.91
  2025-02-10T09:41:01.851754: 472.83

Processing 12 numeric samples:
Sorted Values: [2.83, 4.93, 14.1, 28.86, 89.91, 128.16, 256.44, 319.75, 415.06, 444.41, 461.91, 472.83]
Trimming highest and lowest: [4.93, 14.1, 28.86, 89.91, 128.16, 256.44, 319.75, 415.06, 444.41, 461.91]
Average: 216.353 => Rounded: 216.35
Final pm02Compensated value stored: 216.35

Data logged at 2025-02-10T09:42:05.134554

=== DEBUG: pm02Compensated Samples and Calculation ===
Collected Samples (Timestamp and Value):
  2025-02-10T09:41:28.102435: 106.01
  2025-02-10T09:41:31.140995: 92.78
  2025-02-10T09:41:34.211874: 70.12
  2025-02-10T09:41:37.285647: 53.75
  2025-02-10T09:41:40.353161: 47.85
  2025-02-10T09:41:43.530414: 37.98
  2025-02-10T09:41:46.611290: 33.14
  2025-02-10T09:41:49.695130: 25.99
  2025-02-10T09:41:52.750837: 22.77
  2025-02-10T09:41:55.820521: 19.62
  2025-02-10T09:41:58.904748: 15.32
  2025-02-10T09:42:02.062187: 13.57

Processing 12 numeric samples:
Sorted Values: [13.57, 15.32, 19.62, 22.77, 25.99, 33.14, 37.98, 47.85, 53.75, 70.12, 92.78, 106.01]
Trimming highest and lowest: [15.32, 19.62, 22.77, 25.99, 33.14, 37.98, 47.85, 53.75, 70.12, 92.78]
Average: 41.931999999999995 => Rounded: 41.93
Final pm02Compensated value stored: 41.93

Data logged at 2025-02-10T09:43:04.936802

=== DEBUG: pm02Compensated Samples and Calculation ===
Collected Samples (Timestamp and Value):
  2025-02-10T09:42:28.102523: 3.53
  2025-02-10T09:42:31.151005: 3.1
  2025-02-10T09:42:34.234413: 2.92
  2025-02-10T09:42:37.287007: 0.0
  2025-02-10T09:42:40.364770: 0.0
  2025-02-10T09:42:43.446056: 0.0
  2025-02-10T09:42:46.526924: 0.0
  2025-02-10T09:42:49.577013: 0.0
  2025-02-10T09:42:52.659340: 0.0
  2025-02-10T09:42:55.720521: 0.0
  2025-02-10T09:42:58.794124: 0.0
  2025-02-10T09:43:01.868487: 0.0

Processing 12 numeric samples:
Sorted Values: [0.0, 0.0, 0.0, 0.0, 0.0, 0.0, 0.0, 0.0, 0.0, 2.92, 3.1, 3.53]
Trimming highest and lowest: [0.0, 0.0, 0.0, 0.0, 0.0, 0.0, 0.0, 0.0, 2.92, 3.1]
Average: 0.602 => Rounded: 0.6
Final pm02Compensated value stored: 0.6

Data logged at 2025-02-10T09:44:05.053475

=== DEBUG: pm02Compensated Samples and Calculation ===
Collected Samples (Timestamp and Value):
  2025-02-10T09:43:28.102607: 0.0
  2025-02-10T09:43:31.156735: 0.0
  2025-02-10T09:43:34.234893: 6.06
  2025-02-10T09:43:37.319414: 14.44
  2025-02-10T09:43:40.366756: 90.54
  2025-02-10T09:43:43.440058: 157.62
  2025-02-10T09:43:46.535286: 473.8
  2025-02-10T09:43:49.585015: 673.89
  2025-02-10T09:43:52.654873: 1096.99
  2025-02-10T09:43:55.728116: 1247.96
  2025-02-10T09:43:58.798272: 1328.62
  2025-02-10T09:44:01.847002: 1277.57

Processing 12 numeric samples:
Sorted Values: [0.0, 0.0, 6.06, 14.44, 90.54, 157.62, 473.8, 673.89, 1096.99, 1247.96, 1277.57, 1328.62]
Trimming highest and lowest: [0.0, 6.06, 14.44, 90.54, 157.62, 473.8, 673.89, 1096.99, 1247.96, 1277.57]
Average: 503.887 => Rounded: 503.89
Final pm02Compensated value stored: 503.89

Data logged at 2025-02-10T09:45:05.063191

=== DEBUG: pm02Compensated Samples and Calculation ===
Collected Samples (Timestamp and Value):
  2025-02-10T09:44:28.102687: 156.47
  2025-02-10T09:44:31.159884: 135.9
  2025-02-10T09:44:34.239025: 101.97
  2025-02-10T09:44:37.302389: 88.08
  2025-02-10T09:44:40.374135: 65.68
  2025-02-10T09:44:43.460625: 57.56
  2025-02-10T09:44:46.535438: 45.63
  2025-02-10T09:44:49.590963: 35.09
  2025-02-10T09:44:52.670750: 30.46
  2025-02-10T09:44:55.749919: 21.75
  2025-02-10T09:44:58.805345: 18.3
  2025-02-10T09:45:01.980746: 16.55

Processing 12 numeric samples:
Sorted Values: [16.55, 18.3, 21.75, 30.46, 35.09, 45.63, 57.56, 65.68, 88.08, 101.97, 135.9, 156.47]
Trimming highest and lowest: [18.3, 21.75, 30.46, 35.09, 45.63, 57.56, 65.68, 88.08, 101.97, 135.9]
Average: 60.041999999999994 => Rounded: 60.04
Final pm02Compensated value stored: 60.04

Data logged at 2025-02-10T09:46:04.906214

=== DEBUG: pm02Compensated Samples and Calculation ===
Collected Samples (Timestamp and Value):
  2025-02-10T09:45:28.102805: 31.06
  2025-02-10T09:45:31.162322: 92.0
  2025-02-10T09:45:34.257449: 126.97
  2025-02-10T09:45:37.313573: 192.26
  2025-02-10T09:45:40.378747: 222.16
  2025-02-10T09:45:43.461488: 220.22
  2025-02-10T09:45:46.528455: 197.24
  2025-02-10T09:45:49.597348: 154.23
  2025-02-10T09:45:52.670155: 137.33
  2025-02-10T09:45:55.757070: 108.64
  2025-02-10T09:45:58.826523: 95.28
  2025-02-10T09:46:01.888249: 83.36

Processing 12 numeric samples:
Sorted Values: [31.06, 83.36, 92.0, 95.28, 108.64, 126.97, 137.33, 154.23, 192.26, 197.24, 220.22, 222.16]
Trimming highest and lowest: [83.36, 92.0, 95.28, 108.64, 126.97, 137.33, 154.23, 192.26, 197.24, 220.22]
Average: 140.753 => Rounded: 140.75
Final pm02Compensated value stored: 140.75

Here’s how it behaves with lower values too

=== DEBUG: pm02Compensated Samples and Calculation ===
Collected Samples (Timestamp and Value):
  2025-02-10T09:51:28.103418: 2.94
  2025-02-10T09:51:31.205576: 2.86
  2025-02-10T09:51:34.275515: 2.86
  2025-02-10T09:51:37.357718: 2.86
  2025-02-10T09:51:40.418564: 2.77
  2025-02-10T09:51:43.490516: 0.0
  2025-02-10T09:51:46.580327: 0.0
  2025-02-10T09:51:49.636483: 0.0
  2025-02-10T09:51:52.911827: 0.0
  2025-02-10T09:51:55.984531: 0.0
  2025-02-10T09:51:59.073359: 0.0
  2025-02-10T09:52:02.229144: 0.0

Processing 12 numeric samples:
Sorted Values: [0.0, 0.0, 0.0, 0.0, 0.0, 0.0, 0.0, 2.77, 2.86, 2.86, 2.86, 2.94]
Trimming highest and lowest: [0.0, 0.0, 0.0, 0.0, 0.0, 0.0, 2.77, 2.86, 2.86, 2.86]
Average: 1.135 => Rounded: 1.14
Final pm02Compensated value stored: 1.14

Data logged at 2025-02-10T09:53:05.003288

=== DEBUG: pm02Compensated Samples and Calculation ===
Collected Samples (Timestamp and Value):
  2025-02-10T09:52:28.103525: 0.0
  2025-02-10T09:52:31.209501: 0.0
  2025-02-10T09:52:34.280547: 0.0
  2025-02-10T09:52:37.359848: 0.0
  2025-02-10T09:52:40.425278: 0.0
  2025-02-10T09:52:43.513907: 0.0
  2025-02-10T09:52:46.579651: 0.0
  2025-02-10T09:52:49.640605: 0.0
  2025-02-10T09:52:52.732814: 0.0
  2025-02-10T09:52:55.789193: 0.0
  2025-02-10T09:52:58.867323: 0.0
  2025-02-10T09:53:01.943444: 0.0

Processing 12 numeric samples:
Sorted Values: [0.0, 0.0, 0.0, 0.0, 0.0, 0.0, 0.0, 0.0, 0.0, 0.0, 0.0, 0.0]
Trimming highest and lowest: [0.0, 0.0, 0.0, 0.0, 0.0, 0.0, 0.0, 0.0, 0.0, 0.0]
Average: 0.0 => Rounded: 0.0
Final pm02Compensated value stored: 0.0

Data logged at 2025-02-10T09:54:05.109653

=== DEBUG: pm02Compensated Samples and Calculation ===
Collected Samples (Timestamp and Value):
  2025-02-10T09:53:28.103608: 0.0
  2025-02-10T09:53:31.216438: 0.0
  2025-02-10T09:53:34.296985: 0.0
  2025-02-10T09:53:37.372369: 0.0
  2025-02-10T09:53:40.539583: 0.0
  2025-02-10T09:53:43.604735: 0.0
  2025-02-10T09:53:46.698252: 0.0
  2025-02-10T09:53:49.750345: 0.0
  2025-02-10T09:53:52.832900: 0.0
  2025-02-10T09:53:55.898171: 0.0
  2025-02-10T09:53:58.965873: 0.0
  2025-02-10T09:54:02.044585: 0.0

Processing 12 numeric samples:
Sorted Values: [0.0, 0.0, 0.0, 0.0, 0.0, 0.0, 0.0, 0.0, 0.0, 0.0, 0.0, 0.0]
Trimming highest and lowest: [0.0, 0.0, 0.0, 0.0, 0.0, 0.0, 0.0, 0.0, 0.0, 0.0]
Average: 0.0 => Rounded: 0.0
Final pm02Compensated value stored: 0.0

Data logged at 2025-02-10T09:55:05.014974

=== DEBUG: pm02Compensated Samples and Calculation ===
Collected Samples (Timestamp and Value):
  2025-02-10T09:54:28.103690: 0.0
  2025-02-10T09:54:31.220519: 2.81
  2025-02-10T09:54:34.295498: 2.9
  2025-02-10T09:54:37.366560: 2.9
  2025-02-10T09:54:40.438247: 2.9
  2025-02-10T09:54:43.511212: 2.9
  2025-02-10T09:54:46.606957: 2.9
  2025-02-10T09:54:49.655432: 2.9
  2025-02-10T09:54:52.746052: 2.99
  2025-02-10T09:54:55.799464: 3.07
  2025-02-10T09:54:58.870024: 3.07
  2025-02-10T09:55:01.960419: 3.07

Processing 12 numeric samples:
Sorted Values: [0.0, 2.81, 2.9, 2.9, 2.9, 2.9, 2.9, 2.9, 2.99, 3.07, 3.07, 3.07]
Trimming highest and lowest: [2.81, 2.9, 2.9, 2.9, 2.9, 2.9, 2.9, 2.99, 3.07, 3.07]
Average: 2.9339999999999997 => Rounded: 2.93
Final pm02Compensated value stored: 2.93

Data logged at 2025-02-10T09:56:05.225285

=== DEBUG: pm02Compensated Samples and Calculation ===
Collected Samples (Timestamp and Value):
  2025-02-10T09:55:28.103783: 0.0
  2025-02-10T09:55:31.229108: 0.0
  2025-02-10T09:55:34.301676: 0.0
  2025-02-10T09:55:37.386761: 0.0
  2025-02-10T09:55:40.444171: 2.81
  2025-02-10T09:55:43.516230: 2.99
  2025-02-10T09:55:46.620974: 2.99
  2025-02-10T09:55:49.660691: 3.33
  2025-02-10T09:55:52.835369: 3.42
  2025-02-10T09:55:56.018025: 3.51
  2025-02-10T09:55:59.089630: 3.42
  2025-02-10T09:56:02.154025: 3.25

Processing 12 numeric samples:
Sorted Values: [0.0, 0.0, 0.0, 0.0, 2.81, 2.99, 2.99, 3.25, 3.33, 3.42, 3.42, 3.51]
Trimming highest and lowest: [0.0, 0.0, 0.0, 2.81, 2.99, 2.99, 3.25, 3.33, 3.42, 3.42]
Average: 2.221 => Rounded: 2.22
Final pm02Compensated value stored: 2.22

@Samuel_AirGradient Just was poking around some today.
If you guys dont want to fix it on the HA side like I originally proposed, maybe this is better?

I still think fixing on HA side is better because it won’t negatively impact other things.

Proposed HA side fix (maybe even more sampling should be done here than I proposed)