Here is an example from mine:
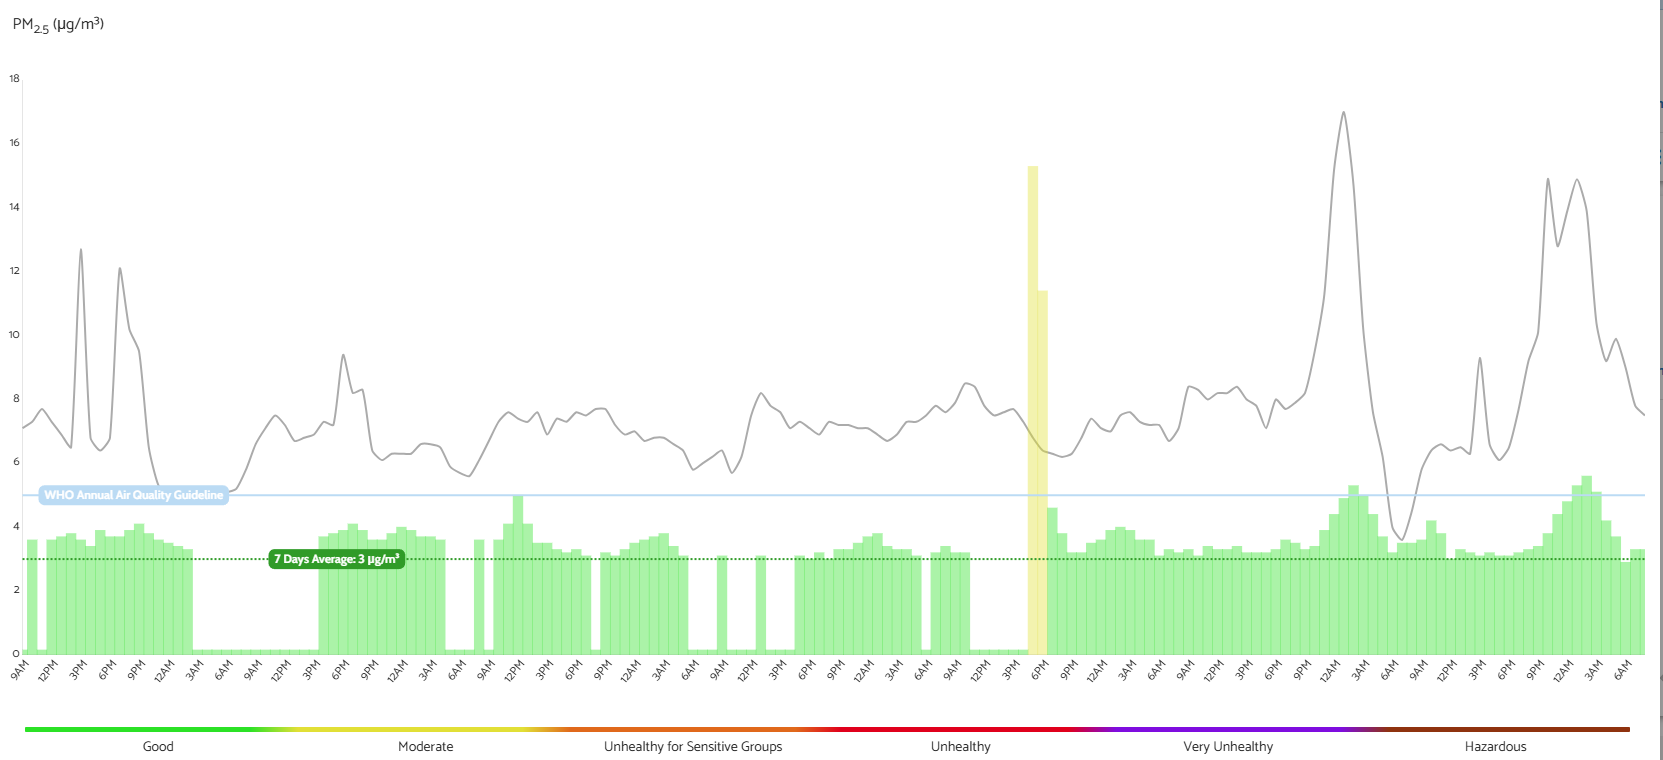
I think these patterns are a result of the implementation of the official US EPA correction algorithm for wildfires when operating in very low concentration and certain humidity concentration ranges.
See especially the section about negative values at the end of the blog post. I believe these could lead to the “jumps”.
@Siriel_AirGradient please add your comment as well.
1 Like
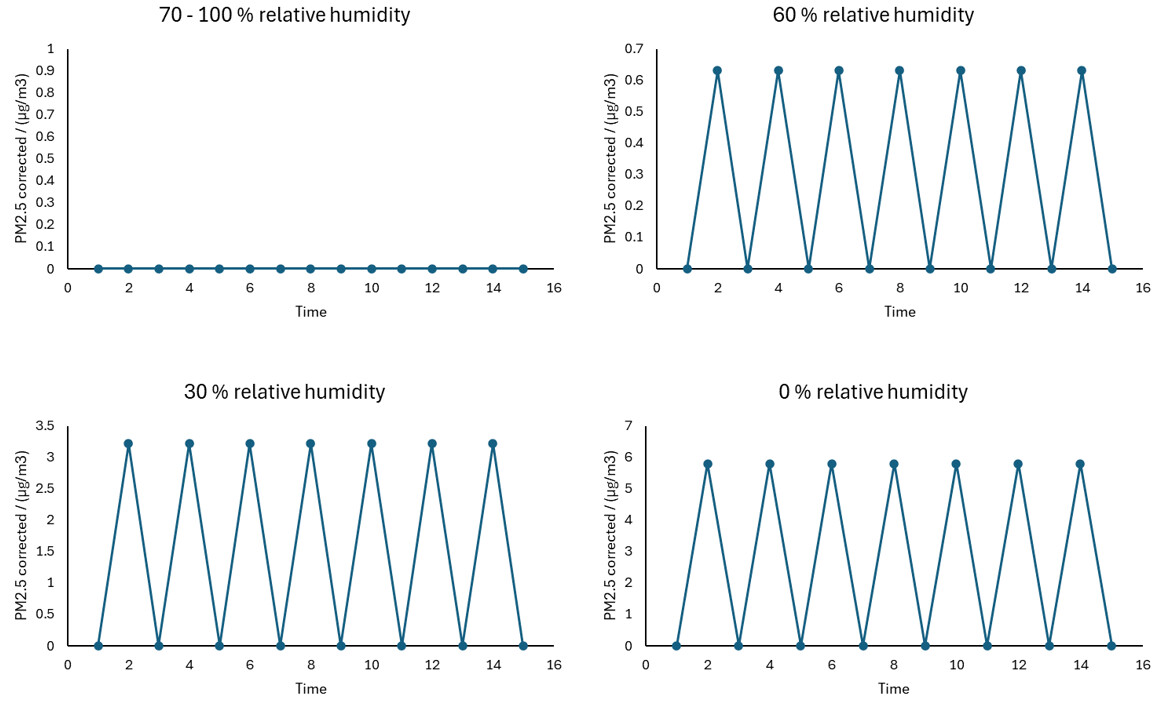
The EPA correction algorithm uses relative humidity to correct PM2.5. Based on the raw PM2.5 reading and humidity, negative corrected values can be obtained. We implemented the algorithm in such a way, that all negative values are replaced by the reading “0 ug/m3” instead. Additionally, we decided to keep the corrected PM2.5 value at 0 ug/m3 if the raw value is 0 ug/m3 (the algorithm as stated by EPA does not do that).
In consequence, patterns as listed below exist when the raw reading changes between two different low values (in this case 0.1 and 0 ug/m3). Note that this is more relevant for low humidity environments.
This might explain the cases reported in this thread. Feel free to post your humidity readings and then I can do some calculations
1 Like
I have been getting this in Australia mostly in the last two days and our humidity is over 50% most of the time as we are not in a low humidity area.
It seems to be happening around 2.x values it will go to zero and back up to 2.x or just stay on zero for a while. I thought I had a faulty connection or error but this is the only sensor and I rebooted. System in operation since Aug 2024. We have no wildfires where I am and rarely do.
Is the EPA correction algorithm even relevant in Australia? This seems new and hasn’t been noiceable up until a week ago and we are not in the 0.1 range, outdoors is usually above 2.0 ug/m3 so the explanation doesn’t seem to match what I understand from your descrition above and the graphs shown. As I read it for those values my humidity would have to be very dry at below 30% and our mininum humidity when this happens is over 50%.
Yesterday it dropped to zero for 6 hours solid with some other random zero reading either side. I thought we could overlay graphs but I only seem to be able to select one graph at time for different monitors of the same measurement so compare inside same measurment to outside but not overlay multiple measurements in Analytics.
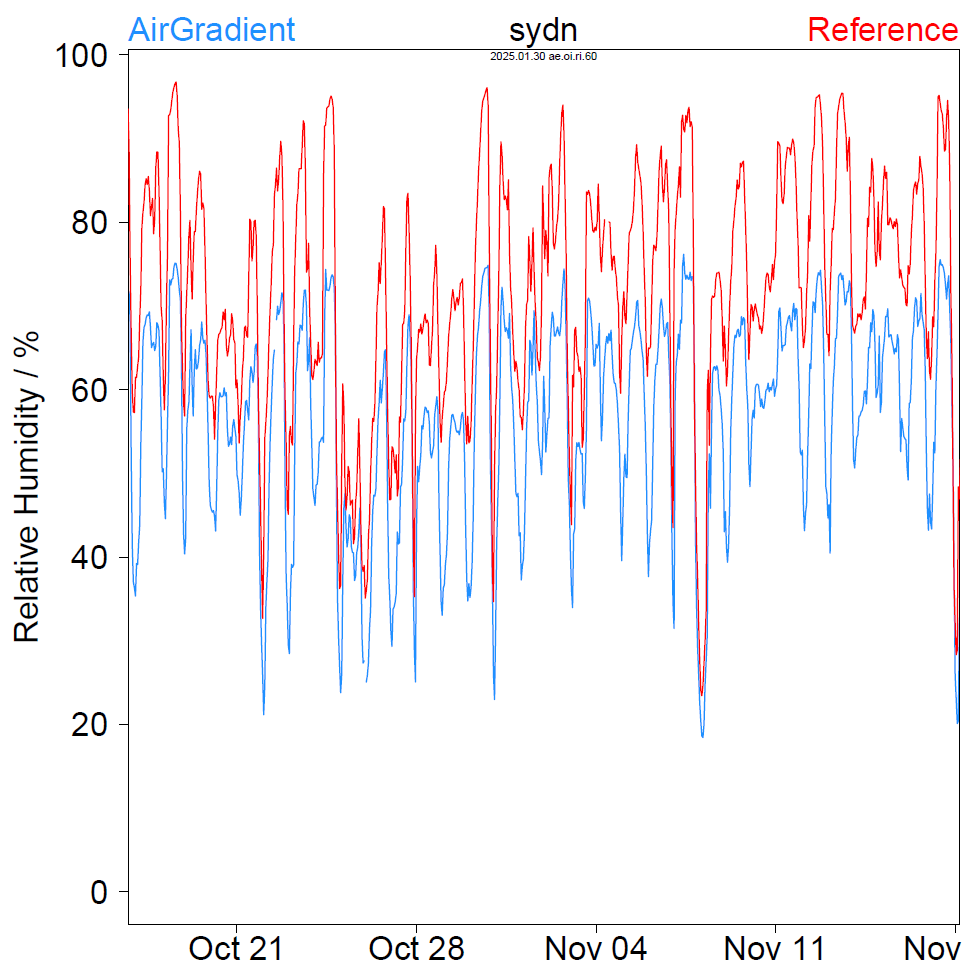
My previous plots refer to raw relative humidity as reported by the Plantower sensors without any correction applied (that’s the humidity the EPA correction uses). We do not know why, but we observed that these sensors underestimate relative humidity. Below an example from an AirGradient OpenAir monitor colocated with a reference in Sydney (Australia). AirGradient data is shown in blue, while the reference is red (hourly averages in 2024).
Does the pattern persist if you switch off the EPA correction? Alternatively, you can export the raw data via the export option in the dashboard and make a plot in excel to look at the pattern (the exported data is raw). This should quickly answer whether the jumping is caused by actual measurements or the correction algorithm.
“Is the EPA correction algorithm even relevant in Australia?”
We observed that the Plantower monitors overestimate PM2.5 at concentrations above 10-20 ug/m3. This finding applies to all investigated locations so far with and without wildfires (America, Europe, Asia, Africa, Oceania). We have no explanation, but we believe it is based on how Plantower calibrates their monitors. The EPA algorithm does a good job at bringing down the high raw readings, while maintaining the low readings, so we recommend using it also in Australia.
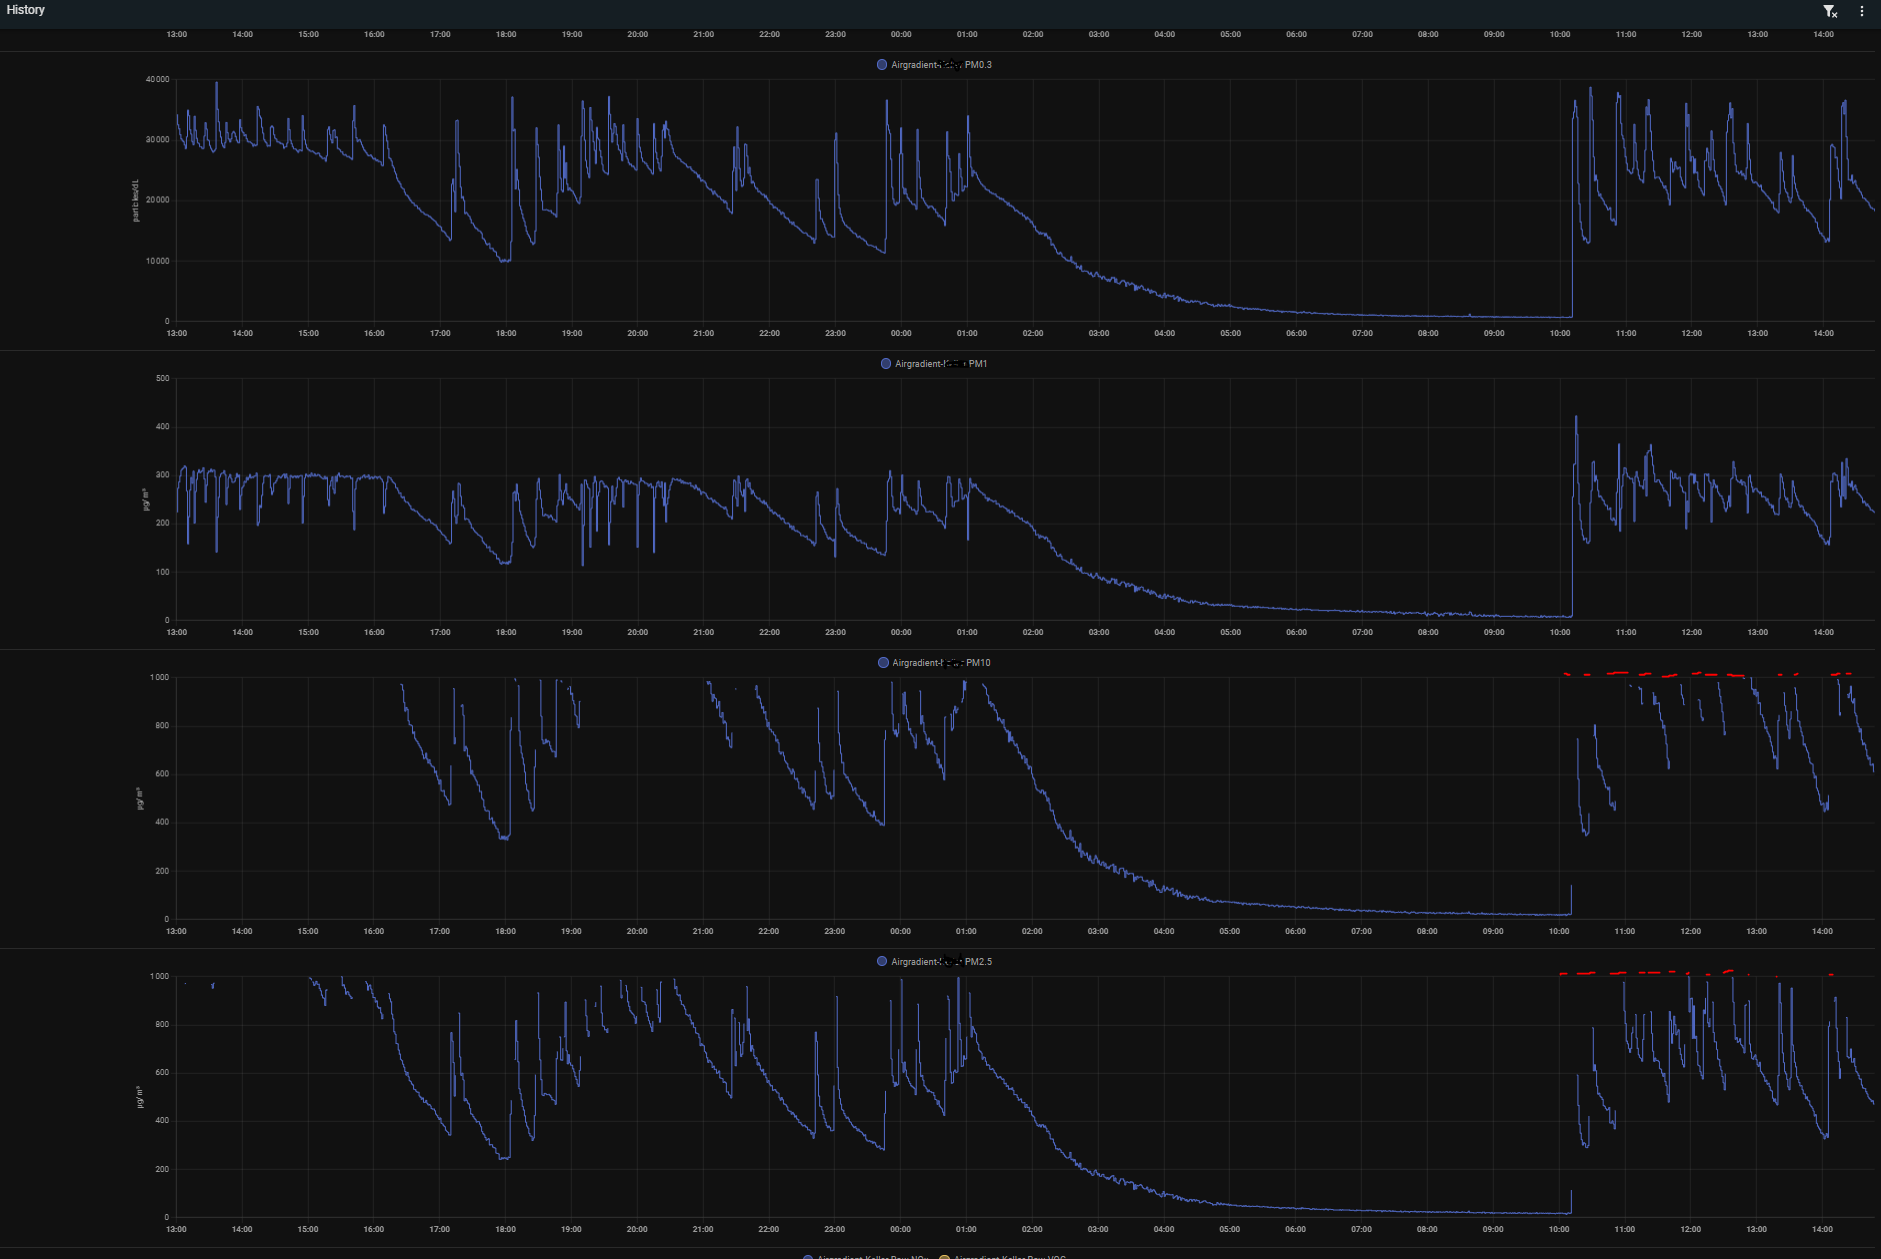
Ive noticed that whenever someone smokes in that Room where the airgradient is located, the PM2.5 and PM10 counter show unknown state in homeassistant and also the PM2.5 on the device itself shows “-” for some time.
Is it a normal behaviour that in case the PM values go up very fast two (2.5 & 10) of the four PM values show unknown until values are not rising so fast any more?!
The sensor drops out at extremely high pollution levels (much more than you typically see in even very polluted areas).
It seems you create more than 1000 ug/m3 by smoking when the sensor drops out. This is as per spec the upper limit of the sensor. So the behavior is to be expected.
1 Like
Yes correct, it then jumps over 1000. Thanks, so i know its normal behaviour.
I turned off the correction and all the zero levels went back to what is expected.
Thanks for all the detail. The summary of what your saying as I read it is the sensor isn’t perfect as we know and your algorithm while not perfect helps remove problematic measurements but in the process creates zero values rather than negative ones.
Not sure if there is some smoothing or other process to stop the graph plotting zero and apearing to malfunction but I expect I can’t be the only person that thinks the behaviour looks like a faulty sensor and many won’t understand this math or even look.
I guess if you have an excess sensor order level this will be why and that waste of time and money would be good to avoid.
I wonder if you can have some sensor diagnosics run that looks at the data history and the adjusted values and advises the customer that this is normal and then presents the reason for people wanting to know why.
At some point all the sensors are likely to fail before the rest so a guide when to replace would be a good feature if its possible.
Many thanks @Siriel_AirGradient for the explanation.
I checked the data again and humidity was between 27% and 40% from 11:30AM until the end of the period and between 40-60% between 1AM and 11AM.
Thanks for sharing the RH ranges! I do not know whether your RH and PM2.5 numbers are raw or corrected, but I tried several combinations and I cannot explain why we observe this pattern in your case. Does it disappear when you switch off the correction?
Many thanks @Siriel_AirGradient . The posted figure was based on corrected data. Some raw PM2.5 and humidity data is attached below. Could sent more but there doesn’t seem to be a possibility to upload files here.
Best, Carsten.
Local Date/Time,PM2.5 (μg/m³),Humidity (%)
2025-01-26 16:00:00,0,40
2025-01-26 15:55:00,0,40
2025-01-26 15:50:00,0.1,39
2025-01-26 15:45:00,0.1,39
2025-01-26 15:40:00,0,37
2025-01-26 15:35:00,0,36
2025-01-26 15:30:00,0.1,35
2025-01-26 15:25:00,0.6,35
2025-01-26 15:20:00,0.6,35
2025-01-26 15:15:00,0.5,34
2025-01-26 15:10:00,0.4,34
2025-01-26 15:05:00,0.1,33
2025-01-26 15:00:00,0.5,32
2025-01-26 14:55:00,0.7,31
2025-01-26 14:50:00,0.6,29
2025-01-26 14:45:00,0.4,28
2025-01-26 14:40:00,0,27
2025-01-26 14:35:00,0,26
2025-01-26 14:30:00,0,26
2025-01-26 14:25:00,0.3,26
2025-01-26 14:20:00,0.2,26
2025-01-26 14:15:00,0.2,25
2025-01-26 14:10:00,0.4,26
2025-01-26 14:05:00,0,26
2025-01-26 14:00:00,0,27
2025-01-26 13:55:00,0,27
2025-01-26 13:50:00,0.3,27
2025-01-26 13:45:00,1.4,27
2025-01-26 13:40:00,0,28
2025-01-26 13:35:00,0,27
2025-01-26 13:30:00,0,27
2025-01-26 13:25:00,0,27
2025-01-26 13:20:00,0.4,27
2025-01-26 13:15:00,0.1,27
2025-01-26 13:10:00,0,27
2025-01-26 13:05:00,0.2,28
2025-01-26 13:00:00,0.1,27
2025-01-26 12:55:00,0.2,28
2025-01-26 12:50:00,0,29
2025-01-26 12:45:00,0.3,30
2025-01-26 12:40:00,0.3,32
2025-01-26 12:35:00,0.2,31
2025-01-26 12:30:00,0,32
2025-01-26 12:25:00,0,34
2025-01-26 12:20:00,0.2,35
2025-01-26 12:15:00,0.8,36
2025-01-26 12:10:00,3.5,36
2025-01-26 12:05:00,0.2,36
2025-01-26 12:00:00,0,37
2025-01-26 05:00:00,0,47
2025-01-26 04:55:00,0,47
2025-01-26 04:50:00,0,47
2025-01-26 04:45:00,0,47
2025-01-26 04:40:00,0,47
2025-01-26 04:35:00,0,48
2025-01-26 04:30:00,0,48
2025-01-26 04:25:00,0,48
2025-01-26 04:20:00,0,49
2025-01-26 04:15:00,0,50
2025-01-26 04:10:00,0.3,50
2025-01-26 04:05:00,0,51
2025-01-26 04:00:00,0,51
2025-01-26 03:55:00,0,51
2025-01-26 03:50:00,0,51
2025-01-26 03:45:00,0,51
2025-01-26 03:40:00,0.2,51
2025-01-26 03:35:00,0,52
2025-01-26 03:30:00,0.2,52
2025-01-26 03:25:00,0,52
2025-01-26 03:20:00,0.1,53
2025-01-26 03:15:00,0.1,53
2025-01-26 03:10:00,0,53
2025-01-26 03:05:00,0,53
2025-01-26 03:00:00,0,53
2025-01-26 02:55:00,0,54
2025-01-26 02:50:00,0,54
2025-01-26 02:45:00,0.1,55
2025-01-26 02:40:00,0,55
2025-01-26 02:35:00,0.2,55
2025-01-26 02:30:00,0,56
2025-01-26 02:25:00,0,57
2025-01-26 02:20:00,0,57
2025-01-26 02:15:00,0,58
2025-01-26 02:10:00,0,59
2025-01-26 02:05:00,0,58
2025-01-26 02:00:00,0,59
Thank you @Carsten for providing the details!
Let’s look at the data from 2025-01-26 15:55:00 with raw PM2.5 of 0 ug/m3 and raw RH of 40 %. According to the EPA algorithm, this would result in a corrected PM2.5 reading of 2.3 ug/m3. However, we do not know whether the raw reading of 0 was at the detection limit of the sensor or below. The true value could genuinely be below 0.5 ug/m3, which is not accounted for by the EPA algorithm. That’s why whe decided to not apply correction to raw readings of 0 ug/m3. In consequence, your raw reading of 0 ug/m3 shows up as a ‘corrected’ value of 0 ug/m3.
5 minutes later, the raw PM2.5 reading was at 0.1 ug/m3 at raw RH of 39 %. Now, we are certain that the PM sensor has actually counted something, so we do apply the correction, which gives us a corrected value of 2.4 ug/m3. As a result, we see this jump from 0 to 2.4 ug/m3, while it jumps back to 0 a couple minutes later.
We understand this leads to a weird pattern that raises doubt on the accuracy of the sensor. The pattern would look smoother (and subjectively ‘better’) if we applied the algorithm also on raw PM2.5 readings of 0 ug/m3 (as done by the EPA). However, we believe this practice introduces a bias as it may lead to corrected PM2.5 values of up to 6 ug/m3 even if the true value is indeed 0 ug/m3.
Your zigzag pattern is the result of a raw reading jumping around the detection limit of the sensor in combination with relatively low humidity.
@Agent86 Thank you for the feedback! I completely agree. We are working on ways to identify faulty sensors and alert the user. This is challenging as PM2.5 is dynamic and can change very quickly (unlike temperature for example). This makes it hard for us to identify unrealistic readings with high certainty, while keeping the number of false positives low. Although we made progress on this end, I do not expect a feature to be ready in near future.
Many thanks for the detailed explanation!
Best, Carsten
1 Like
For those in this thread following along,
I am not an AQ expert or a scientist, I am an IT professional. I’m also not affiliated with AirGradient, I am just some guy on the internet.
I think a part of the problem here is how we are sampling data across various implementations.
As discussed here:
The AirGradient will report very differant numbers within very short periods of time. I expect this behavior to be inherent to the sensor itself. Some compensation for this can be applied for graphing and display purposes, as discussed here:
Also, as stated in the above discussion, I would argue that such smoothing should only be applied for display purposes. Seperate from my PR above, I also think the AirGradient App should also reflect better logic. Take a few samples 3 seconds apart and average them before storing a value in the cloud . The local API server should always be the source of truth for data at a quantum in time, and it should not be smoothed.
Applying correction algorithms like the EPA one is appropriate, but altering the data for smoothing purposes will negatively affect integrations that have a very high sample rate.
Since the Air Gradient Cloud App has a sample rate of 5 minutes, smoothing can, and should be applied. But again, this smoothing should be done in the cloud by collecting more samples, not in the device IMO. For each 5 minute interval, collect 3 samples 3 seconds apart and average them. This would, in my opinion, result in the best data for this application.
If we assume the local API as a single source of truth, much of the uncertainty can be eliminated.
@Carsten do you have a Linux or MacOS machine available in your environment?
Running this script will sample PM2.5 from the API every 3 seconds for 5 minutes. You’ll have to replace the IP with your IP or the mdns name of your sensor.
for i in {1..300}; do echo "$(date '+%Y-%m-%d %H:%M:%S') pm02Compensated: $(curl -s http://10.69.10.92/measures/current | jq -r '.pm02Compensated')"; sleep 3; done
I’d be interested in what this looks like versus the graphs you are seeing.
We are actually already taking ten or twenty measurements in a row and average them before sending to the server.
Though, I am not sure if we transmit decimal numbers. @Samuel_AirGradient can you check this? If not, that might become a piece of the solution.
1 Like
Home Assitant was only taking one, so I suspect some of the confusion when users are comparing were a direct result from that…where the cloud actually had better data. I’m happy the cloud app does have this logic! 
The decimal places in the Cloud app calculation would definitely affect users with consistently low PM values. Math’s fun xD
I ran the above script locally here
root@prod[~]# for i in {1..300}; do echo "$(date '+%Y-%m-%d %H:%M:%S') pm02Compensated: $(curl -s http://10.69.10.92/measures/current | jq -r '.pm02Compensated')"; sleep 3; done
2025-02-09 12:57:08 pm02Compensated: 3.02
2025-02-09 12:57:11 pm02Compensated: 3.02
2025-02-09 12:57:14 pm02Compensated: 3.02
2025-02-09 12:57:18 pm02Compensated: 3.11
2025-02-09 12:57:21 pm02Compensated: 9.66
2025-02-09 12:57:24 pm02Compensated: 45.73
2025-02-09 12:57:27 pm02Compensated: 45.72
2025-02-09 12:57:31 pm02Compensated: 96.16
2025-02-09 12:57:34 pm02Compensated: 153.27
2025-02-09 12:57:37 pm02Compensated: 252.35
2025-02-09 12:57:41 pm02Compensated: 350.14
2025-02-09 12:57:44 pm02Compensated: 438.96
2025-02-09 12:57:47 pm02Compensated: 479.18
2025-02-09 12:57:50 pm02Compensated: 471.85
2025-02-09 12:57:53 pm02Compensated: 436.83
2025-02-09 12:57:57 pm02Compensated: 384.68
2025-02-09 12:58:00 pm02Compensated: 322.7
2025-02-09 12:58:03 pm02Compensated: 259.37
2025-02-09 12:58:06 pm02Compensated: 188.2
2025-02-09 12:58:09 pm02Compensated: 144.78
2025-02-09 12:58:13 pm02Compensated: 115.17
2025-02-09 12:58:16 pm02Compensated: 115.18
2025-02-09 12:58:19 pm02Compensated: 90.55
2025-02-09 12:58:22 pm02Compensated: 71.43
2025-02-09 12:58:26 pm02Compensated: 55.97
2025-02-09 12:58:29 pm02Compensated: 43.93
2025-02-09 12:58:32 pm02Compensated: 33.07
2025-02-09 12:58:35 pm02Compensated: 24.49
2025-02-09 12:58:38 pm02Compensated: 18.83
2025-02-09 12:58:42 pm02Compensated: 15.73
2025-02-09 12:58:45 pm02Compensated: 13.2
2025-02-09 12:58:48 pm02Compensated: 10.93
2025-02-09 12:58:51 pm02Compensated: 8.92
2025-02-09 12:58:54 pm02Compensated: 7.44
2025-02-09 12:58:57 pm02Compensated: 6.13
2025-02-09 12:59:01 pm02Compensated: 5.26
2025-02-09 12:59:04 pm02Compensated: 5.26
2025-02-09 12:59:07 pm02Compensated: 4.65
2025-02-09 12:59:10 pm02Compensated: 4.21
2025-02-09 12:59:13 pm02Compensated: 3.78
2025-02-09 12:59:17 pm02Compensated: 3.43
2025-02-09 12:59:20 pm02Compensated: 3.35
2025-02-09 12:59:23 pm02Compensated: 3.26
2025-02-09 12:59:27 pm02Compensated: 3.17
2025-02-09 12:59:30 pm02Compensated: 3.08
2025-02-09 12:59:33 pm02Compensated: 3.08
2025-02-09 12:59:36 pm02Compensated: 3.17
2025-02-09 12:59:40 pm02Compensated: 3.08
2025-02-09 12:59:43 pm02Compensated: 2.99
2025-02-09 12:59:46 pm02Compensated: 2.9
2025-02-09 12:59:49 pm02Compensated: 2.9
2025-02-09 12:59:53 pm02Compensated: 0
2025-02-09 13:00:15 pm02Compensated: 0
2025-02-09 13:00:18 pm02Compensated: 7.54
2025-02-09 13:00:21 pm02Compensated: 4.92
2025-02-09 13:00:24 pm02Compensated: 4.39
2025-02-09 13:00:27 pm02Compensated: 3.96
2025-02-09 13:00:31 pm02Compensated: 3.26
2025-02-09 13:00:34 pm02Compensated: 3
2025-02-09 13:00:37 pm02Compensated: 3
2025-02-09 13:00:40 pm02Compensated: 3.09
2025-02-09 13:00:43 pm02Compensated: 3.1
2025-02-09 13:00:46 pm02Compensated: 3.1
2025-02-09 13:00:49 pm02Compensated: 3.01
2025-02-09 13:00:52 pm02Compensated: 2.92
2025-02-09 13:00:55 pm02Compensated: 0
2025-02-09 13:00:58 pm02Compensated: 2.92
2025-02-09 13:01:01 pm02Compensated: 3
2025-02-09 13:01:04 pm02Compensated: 3.18
2025-02-09 13:01:07 pm02Compensated: 3.26
2025-02-09 13:01:11 pm02Compensated: 3.35
2025-02-09 13:01:14 pm02Compensated: 3.26
2025-02-09 13:01:17 pm02Compensated: 3.09
2025-02-09 13:01:20 pm02Compensated: 3
2025-02-09 13:01:23 pm02Compensated: 0
2025-02-09 13:01:26 pm02Compensated: 2.91
2025-02-09 13:01:29 pm02Compensated: 2.91
2025-02-09 13:01:32 pm02Compensated: 3.09
2025-02-09 13:01:35 pm02Compensated: 3.09
2025-02-09 13:01:38 pm02Compensated: 3.17
2025-02-09 13:01:41 pm02Compensated: 3.17
2025-02-09 13:01:45 pm02Compensated: 3
2025-02-09 13:01:48 pm02Compensated: 3
2025-02-09 13:01:51 pm02Compensated: 0
2025-02-09 13:01:54 pm02Compensated: 0
2025-02-09 13:01:57 pm02Compensated: 0
2025-02-09 13:02:00 pm02Compensated: 0
2025-02-09 13:02:03 pm02Compensated: 0
2025-02-09 13:02:06 pm02Compensated: 0
2025-02-09 13:02:09 pm02Compensated: 0
2025-02-09 13:02:12 pm02Compensated: 0
2025-02-09 13:02:15 pm02Compensated: 0
2025-02-09 13:02:19 pm02Compensated: 0
2025-02-09 13:02:22 pm02Compensated: 0
2025-02-09 13:02:25 pm02Compensated: 0
2025-02-09 13:02:28 pm02Compensated: 0
2025-02-09 13:02:31 pm02Compensated: 0
2025-02-09 13:02:34 pm02Compensated: 0
2025-02-09 13:02:37 pm02Compensated: 0
2025-02-09 13:02:40 pm02Compensated: 0
2025-02-09 13:02:43 pm02Compensated: 0
2025-02-09 13:02:46 pm02Compensated: 0
2025-02-09 13:02:50 pm02Compensated: 0
2025-02-09 13:02:53 pm02Compensated: 0
2025-02-09 13:02:56 pm02Compensated: 0
2025-02-09 13:02:59 pm02Compensated: 0
2025-02-09 13:03:02 pm02Compensated: 0
2025-02-09 13:03:05 pm02Compensated: 0
2025-02-09 13:03:08 pm02Compensated: 0
2025-02-09 13:03:11 pm02Compensated: 0
2025-02-09 13:03:14 pm02Compensated: 0
2025-02-09 13:03:17 pm02Compensated: 0
2025-02-09 13:03:20 pm02Compensated: 0
2025-02-09 13:03:24 pm02Compensated: 0
2025-02-09 13:03:27 pm02Compensated: 0
2025-02-09 13:03:30 pm02Compensated: 0
2025-02-09 13:03:33 pm02Compensated: 0
2025-02-09 13:03:36 pm02Compensated: 0
2025-02-09 13:03:39 pm02Compensated: 0
2025-02-09 13:03:42 pm02Compensated: 0
2025-02-09 13:03:45 pm02Compensated: 0
2025-02-09 13:03:48 pm02Compensated: 0
2025-02-09 13:03:51 pm02Compensated: 0
2025-02-09 13:03:54 pm02Compensated: 0
2025-02-09 13:03:57 pm02Compensated: 0
2025-02-09 13:04:01 pm02Compensated: 0
2025-02-09 13:04:04 pm02Compensated: 0
2025-02-09 13:04:07 pm02Compensated: 0
2025-02-09 13:04:10 pm02Compensated: 0
2025-02-09 13:04:13 pm02Compensated: 0
2025-02-09 13:04:16 pm02Compensated: 0
2025-02-09 13:04:19 pm02Compensated: 2.92
2025-02-09 13:04:22 pm02Compensated: 2.92
2025-02-09 13:04:25 pm02Compensated: 3
2025-02-09 13:04:28 pm02Compensated: 3.08
2025-02-09 13:04:31 pm02Compensated: 3.26
2025-02-09 13:04:34 pm02Compensated: 3.26
2025-02-09 13:04:37 pm02Compensated: 3.26
2025-02-09 13:04:41 pm02Compensated: 3.17
2025-02-09 13:04:44 pm02Compensated: 3.17
2025-02-09 13:04:47 pm02Compensated: 3.17
2025-02-09 13:04:50 pm02Compensated: 3.17
2025-02-09 13:04:53 pm02Compensated: 3.08
2025-02-09 13:04:56 pm02Compensated: 2.99
2025-02-09 13:04:59 pm02Compensated: 2.99
2025-02-09 13:05:02 pm02Compensated: 2.91
2025-02-09 13:05:05 pm02Compensated: 3
2025-02-09 13:05:08 pm02Compensated: 3.35
2025-02-09 13:05:11 pm02Compensated: 3.44
2025-02-09 13:05:15 pm02Compensated: 3.44
2025-02-09 13:05:18 pm02Compensated: 3.26
2025-02-09 13:05:21 pm02Compensated: 2.99
2025-02-09 13:05:24 pm02Compensated: 2.99
2025-02-09 13:05:27 pm02Compensated: 3.16
2025-02-09 13:05:30 pm02Compensated: 3.25
2025-02-09 13:05:33 pm02Compensated: 3.25
2025-02-09 13:05:36 pm02Compensated: 3.25
2025-02-09 13:05:39 pm02Compensated: 3.16
2025-02-09 13:05:42 pm02Compensated: 3.16
2025-02-09 13:05:45 pm02Compensated: 3.07
2025-02-09 13:05:48 pm02Compensated: 2.9
2025-02-09 13:05:51 pm02Compensated: 2.9
2025-02-09 13:05:55 pm02Compensated: 2.98
2025-02-09 13:05:58 pm02Compensated: 2.98
2025-02-09 13:06:01 pm02Compensated: 2.98
2025-02-09 13:06:04 pm02Compensated: 3.07
2025-02-09 13:06:07 pm02Compensated: 2.98
2025-02-09 13:06:10 pm02Compensated: 2.98
2025-02-09 13:06:13 pm02Compensated: 2.98
2025-02-09 13:06:16 pm02Compensated: 3.07
2025-02-09 13:06:19 pm02Compensated: 3.07
2025-02-09 13:06:22 pm02Compensated: 2.99
2025-02-09 13:06:25 pm02Compensated: 3.08
2025-02-09 13:06:28 pm02Compensated: 3.08
2025-02-09 13:06:31 pm02Compensated: 3.26
2025-02-09 13:06:35 pm02Compensated: 3.26
2025-02-09 13:06:38 pm02Compensated: 3.08
2025-02-09 13:06:41 pm02Compensated: 2.99
2025-02-09 13:06:44 pm02Compensated: 2.99
2025-02-09 13:06:47 pm02Compensated: 3.07
2025-02-09 13:06:50 pm02Compensated: 3.25
2025-02-09 13:06:53 pm02Compensated: 3.25
2025-02-09 13:06:56 pm02Compensated: 3.17
2025-02-09 13:06:59 pm02Compensated: 3.17
2025-02-09 13:07:02 pm02Compensated: 3.25
2025-02-09 13:07:05 pm02Compensated: 3.52
2025-02-09 13:07:08 pm02Compensated: 3.69
2025-02-09 13:07:11 pm02Compensated: 3.87
2025-02-09 13:07:14 pm02Compensated: 3.7
2025-02-09 13:07:18 pm02Compensated: 3.43
2025-02-09 13:07:21 pm02Compensated: 3.17
2025-02-09 13:07:24 pm02Compensated: 3.08
2025-02-09 13:07:27 pm02Compensated: 3.25
2025-02-09 13:07:30 pm02Compensated: 3.16
2025-02-09 13:07:33 pm02Compensated: 3.07
2025-02-09 13:07:36 pm02Compensated: 2.98
2025-02-09 13:07:39 pm02Compensated: 0
2025-02-09 13:07:42 pm02Compensated: 0
2025-02-09 13:07:45 pm02Compensated: 6.97
2025-02-09 13:07:49 pm02Compensated: 18.65
2025-02-09 13:07:52 pm02Compensated: 109.5
2025-02-09 13:07:55 pm02Compensated: 349.05
2025-02-09 13:07:58 pm02Compensated: 529.66
2025-02-09 13:08:01 pm02Compensated: 948.89
2025-02-09 13:08:04 pm02Compensated: 1136.21
2025-02-09 13:08:07 pm02Compensated: 1264.21
2025-02-09 13:08:10 pm02Compensated: 1334.69
2025-02-09 13:08:13 pm02Compensated: 1279.43
2025-02-09 13:08:16 pm02Compensated: 1087.97
2025-02-09 13:08:20 pm02Compensated: 980.06
2025-02-09 13:08:23 pm02Compensated: 771.77
2025-02-09 13:08:26 pm02Compensated: 681.78
2025-02-09 13:08:29 pm02Compensated: 526.86
2025-02-09 13:08:32 pm02Compensated: 459.74
2025-02-09 13:08:35 pm02Compensated: 340.83
2025-02-09 13:08:38 pm02Compensated: 293.2
2025-02-09 13:08:41 pm02Compensated: 200.2
2025-02-09 13:08:44 pm02Compensated: 162.82
2025-02-09 13:08:47 pm02Compensated: 123.25
2025-02-09 13:08:50 pm02Compensated: 107.01
2025-02-09 13:08:53 pm02Compensated: 81.47
2025-02-09 13:08:56 pm02Compensated: 62.87
2025-02-09 13:08:59 pm02Compensated: 55.92
2025-02-09 13:09:03 pm02Compensated: 45.57
2025-02-09 13:09:06 pm02Compensated: 40.84
2025-02-09 13:09:09 pm02Compensated: 36.69
2025-02-09 13:09:12 pm02Compensated: 35.58
2025-02-09 13:09:15 pm02Compensated: 38.27
2025-02-09 13:09:18 pm02Compensated: 44.26
2025-02-09 13:09:21 pm02Compensated: 45.31
2025-02-09 13:09:24 pm02Compensated: 45.18
2025-02-09 13:09:27 pm02Compensated: 43.61
2025-02-09 13:09:30 pm02Compensated: 36.03
2025-02-09 13:09:33 pm02Compensated: 32.38
2025-02-09 13:09:36 pm02Compensated: 24.6
2025-02-09 13:09:39 pm02Compensated: 20.99
2025-02-09 13:09:43 pm02Compensated: 16.45
2025-02-09 13:09:46 pm02Compensated: 14.7
2025-02-09 13:09:49 pm02Compensated: 11.83
2025-02-09 13:09:52 pm02Compensated: 10.7
2025-02-09 13:09:55 pm02Compensated: 8.78
2025-02-09 13:09:58 pm02Compensated: 7.29
2025-02-09 13:10:01 pm02Compensated: 6.59
2025-02-09 13:10:04 pm02Compensated: 5.37
2025-02-09 13:10:07 pm02Compensated: 4.84
2025-02-09 13:10:10 pm02Compensated: 4.49
2025-02-09 13:10:13 pm02Compensated: 3.96
2025-02-09 13:10:16 pm02Compensated: 3.79
2025-02-09 13:10:19 pm02Compensated: 3.7
2025-02-09 13:10:22 pm02Compensated: 3.7
2025-02-09 13:10:26 pm02Compensated: 3.88
2025-02-09 13:10:29 pm02Compensated: 4.05
2025-02-09 13:10:32 pm02Compensated: 3.96
2025-02-09 13:10:35 pm02Compensated: 4.05
2025-02-09 13:10:38 pm02Compensated: 4.14
2025-02-09 13:10:41 pm02Compensated: 4.23
2025-02-09 13:10:44 pm02Compensated: 4.58
2025-02-09 13:10:47 pm02Compensated: 4.67
2025-02-09 13:10:50 pm02Compensated: 16.19
2025-02-09 13:10:53 pm02Compensated: 45.44
2025-02-09 13:10:56 pm02Compensated: 121.94
You can see clearly the issue is exaggerated and more apparent when PM numbers are very high.
Currently, we have different conditions (more PM2.5, higher humidity) so I won’t be able to obtain comparable data via the API but maybe in the future.
Best, Carsten.