AirGradient Forum

Local API Questions/Versioning? : airgradient-csv-writer

Hey everyone,

I’m working on a basic CSV writer python script that will periodically query the API and write values to a CSV I can then use with Grafana to make graphs.

I’m planning on writing this up and sharing a bit more once I’m ready, but I wanted to ask a question before I get too deeply invested.

My question is,
As API versioning planned? As new fields are added for new sensor or new information is exposed, will the URL for the local API server change? I would really like to see new functions show up in /http://10.69.10.92/measures/v2/current/ or something, which is pretty typical in the industry.
Current API docs are here:

Properties Type Explanation
serialno String Serial Number of the monitor
wifi Number WiFi signal strength
pm01 Number PM1.0 in ug/m3 (atmospheric environment)
pm02 Number PM2.5 in ug/m3 (atmospheric environment)
pm10 Number PM10 in ug/m3 (atmospheric environment)
pm02Compensated Number PM2.5 in ug/m3 with correction applied (from fw version 3.1.4 onwards)
pm01Standard Number PM1.0 in ug/m3 (standard particle)
pm02Standard Number PM2.5 in ug/m3 (standard particle)
pm10Standard Number PM10 in ug/m3 (standard particle)
rco2 Number CO2 in ppm
pm003Count Number Particle count 0.3um per dL
pm005Count Number Particle count 0.5um per dL
pm01Count Number Particle count 1.0um per dL
pm02Count Number Particle count 2.5um per dL
pm50Count Number Particle count 5.0um per dL (only for indoor monitor)
pm10Count Number Particle count 10um per dL (only for indoor monitor)
atmp Number Temperature in Degrees Celsius
atmpCompensated Number Temperature in Degrees Celsius with correction applied
rhum Number Relative Humidity
rhumCompensated Number Relative Humidity with correction applied
tvocIndex Number Senisiron VOC Index
tvocRaw Number VOC raw value
noxIndex Number Senisirion NOx Index
noxRaw Number NOx raw value
boot Number Counts every measurement cycle. Low boot counts indicate restarts.
bootCount Number Same as boot property. Required for Home Assistant compatability. (deprecated soon!)
ledMode String Current configuration of the LED mode
firmware String Current firmware version
model String Current model name

I’m just trying to plan around potential breaking changes that get pulled down in OTA updates. Given the amount of rapid change here, particularly in compensation algorithms, I worry about the the fields changing.

If pm02Compensated has a differant meaning in 3.1.21 version now than it will in a future version 3.2.xx, the graph will no longer represent the same data, as an example.

Or maybe pm02Compensated will become pm02CompensatedEPA and my script will break entirely. I’ve also asked here for a new field maybe someday: Feature Request: API IP Address Information/Static IPs - #5 by nickf1227
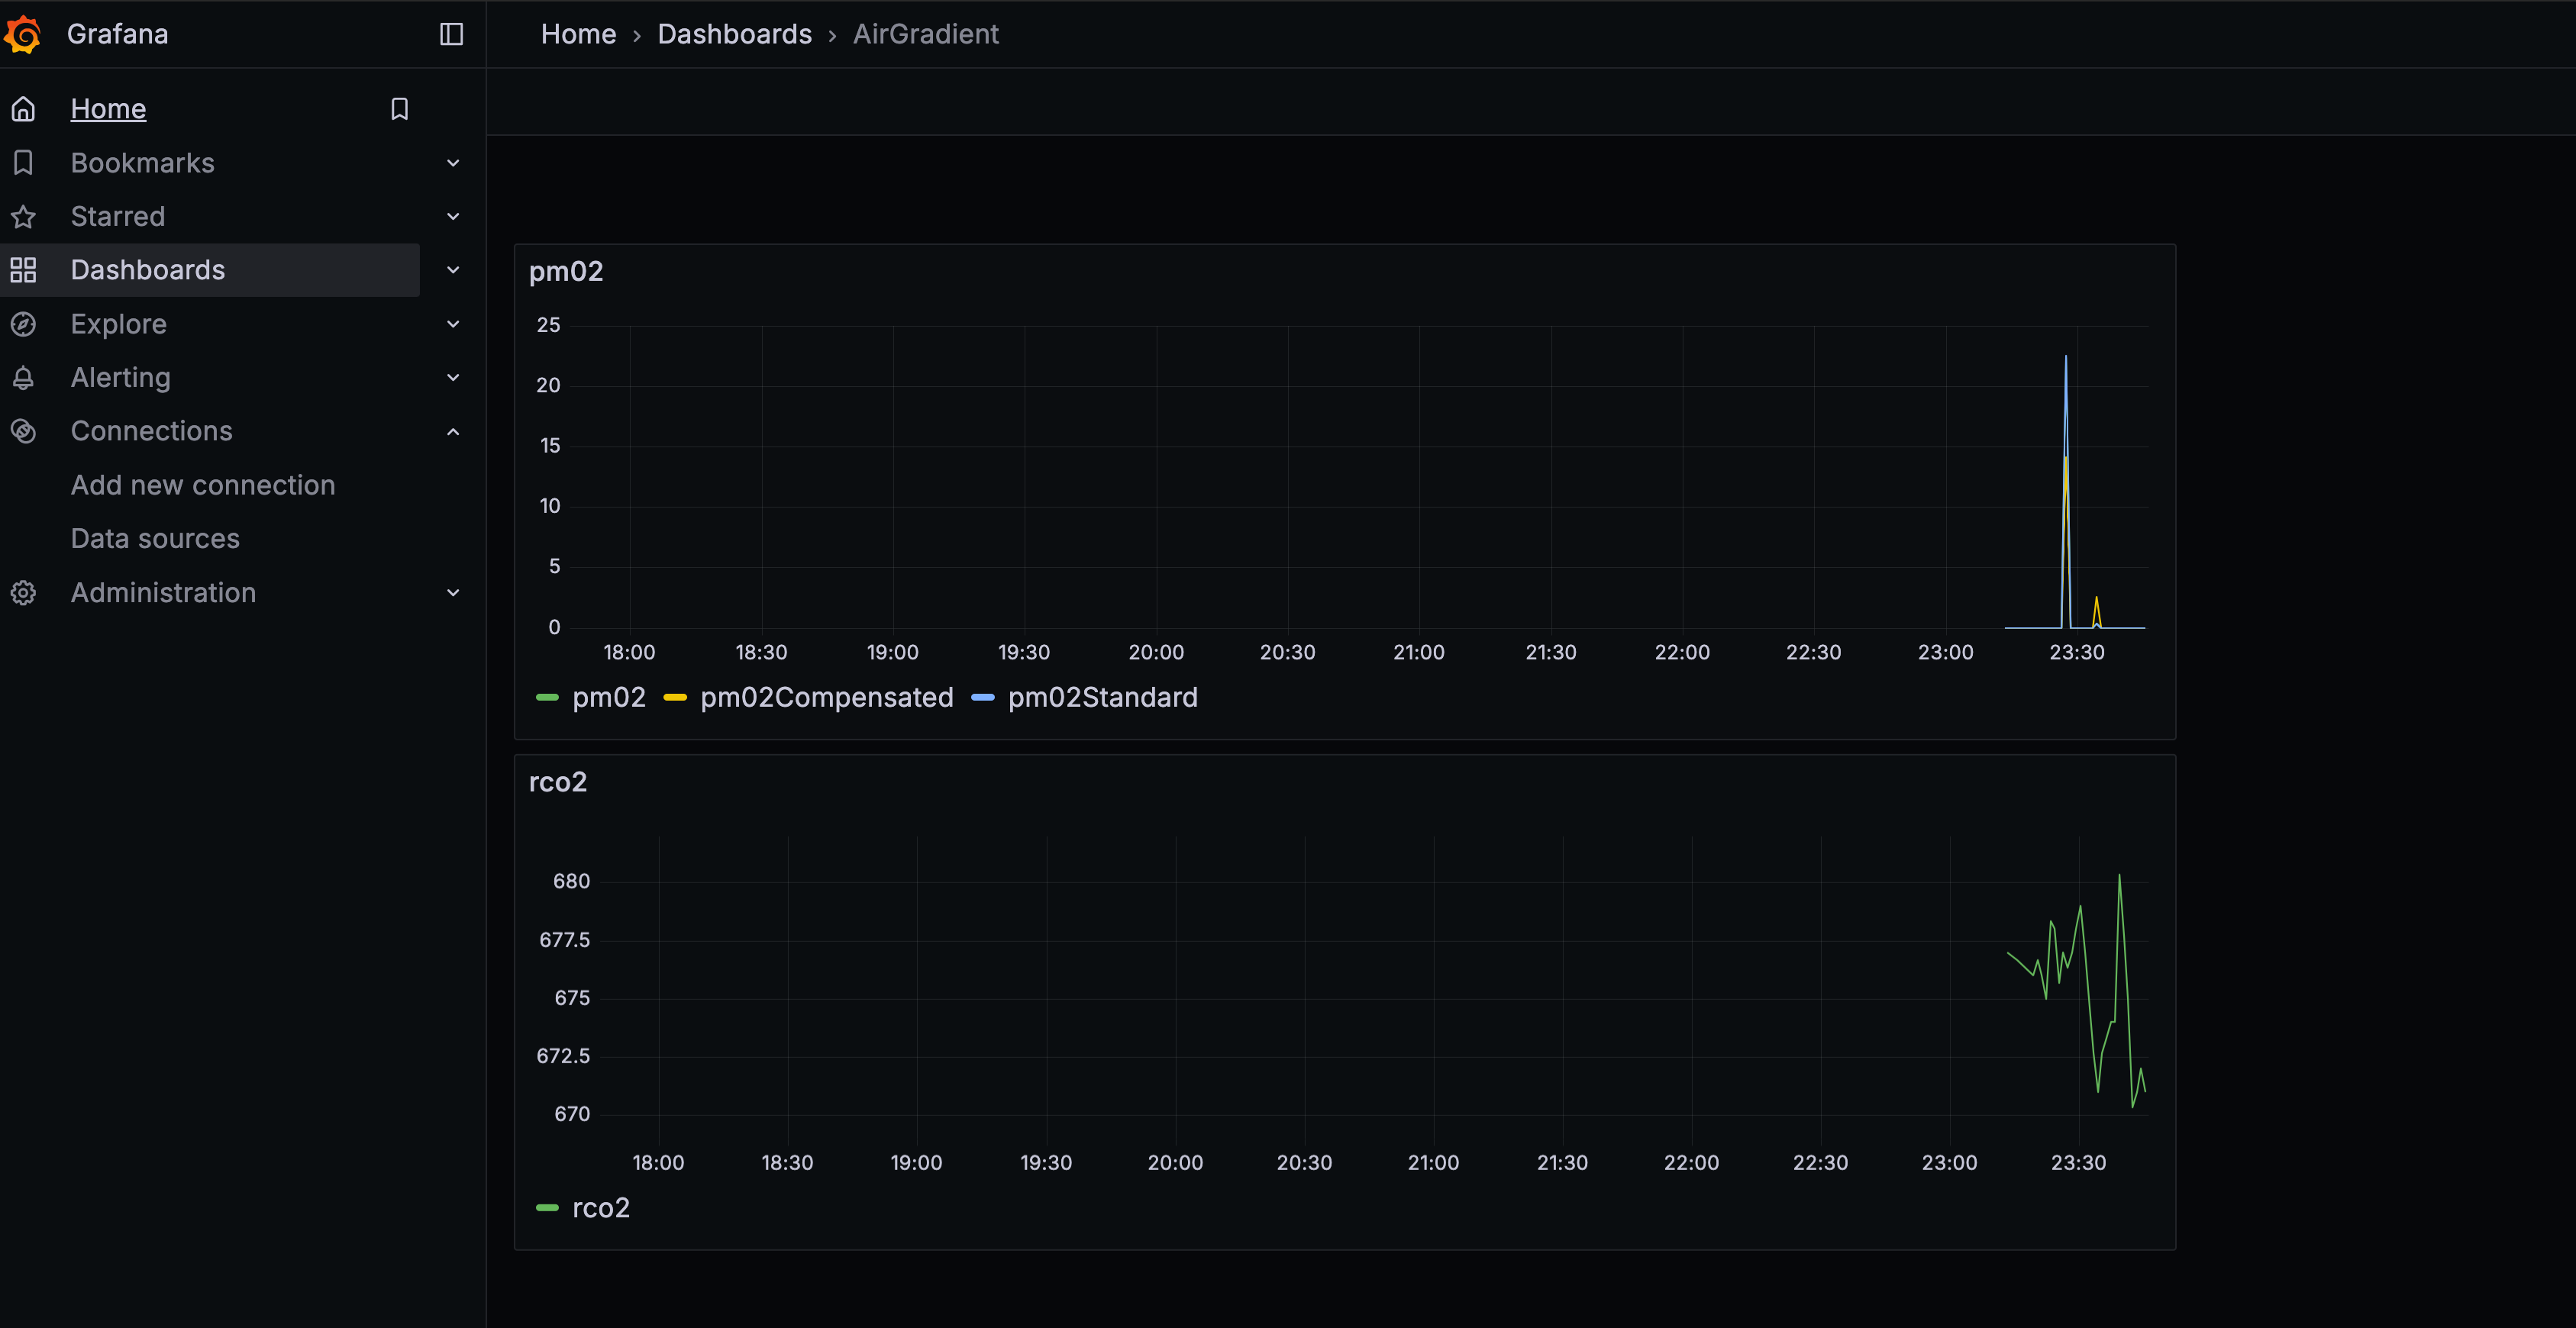
Results so far:

Hi @nickf1227 ,

Nice work! But i have suggestion for you if at the end you want to plot to grafana, you can use the monitor openmetrics endpoints, its payload format already native to prometheus.

We don’t have a plan to add versioning for the local server endpoints but we will make sure something like this will not change dynamically since we know a lot of integration depends on this.

1 Like

Fair enough!

I am only using csv files because the data is not that large and is now much easier to integrate into other things. A database software seems like overkill because I will not be doing any concurrent locking or updating of tables among many endpoints.

I also I don’t want to be vendor locked into a specific graphing suite.

I can automate graphs in grafana, but I can also do it in python with plotly

Or even just Excel or Google sheets.

CSV files are compatible with a wide range of software.

1 Like

@Samuel_AirGradient Also, because it’s in such a generic format, it allows me to do fun data manipulation things in python with ChatGPT instead of having to learn how to do crazy advanced things in some random software :slight_smile:

When I actually get 7 clean days of me not messing with collections or moving sensors around, I will maybe learn something interesting. :stuck_out_tongue:

root@m50[/mnt/fire/tn_scripts]# python3 airgradient_report.py
======================================================================
                AIR GRADIENT SENSOR REPORT
======================================================================
File: /mnt/fire/tn_scripts/airgradient.csv
Report Generated on: 2025-02-16 02:02:13
======================================================================

######################################################################
>> METRIC: Temperature (°F)  [Units: °F]
######################################################################
>> Current Reading:
   Value: 71.33 at 2025-02-16 02:01:47

>> Rolling Averages:
   (The rolling averages represent the mean value of the metric over the last 1 day and 7 days, respectively.)
   1-day Average: 72.76
   7-day Average: 74.59

>> 7-Day Window Statistics:
   (These statistics are computed over the last 7 days of data.)
   Highest: 83.19 at 2025-02-13 14:25:51
   Lowest: 31.77 at 2025-02-13 22:16:02
   Median: 74.12
   Count: 8279
   Std Dev: 4.82
   Range: 51.43

>> Trend Analysis:
   (Trend Analysis compares the 1-day and 7-day averages to indicate short-term changes,
    and shows the deviation of the current reading from the 7-day average.)
   1-day vs 7-day Trend: -2.45%
   Deviation from 7-day Avg: -4.37%

>> Outlier Analysis:
   (Outliers are determined using the Interquartile Range (IQR) method;
    the top 5 worst outliers are listed based on their deviation from the median.)
   Top 5 Worst Outliers:
      1. 31.77 at 2025-02-13 22:16:02
      2. 31.87 at 2025-02-13 22:19:01
      3. 31.91 at 2025-02-13 22:17:01
      4. 31.93 at 2025-02-13 22:18:01
      5. 31.95 at 2025-02-13 22:15:01

======================================================================

######################################################################
>> METRIC: Relative Humidity (%)  [Units: %]
######################################################################
>> Current Reading:
   Value: 41.79 at 2025-02-16 02:01:47

>> Rolling Averages:
   (The rolling averages represent the mean value of the metric over the last 1 day and 7 days, respectively.)
   1-day Average: 38.42
   7-day Average: 38.42

>> 7-Day Window Statistics:
   (These statistics are computed over the last 7 days of data.)
   Highest: 96.31 at 2025-02-13 22:24:17
   Lowest: 30.16 at 2025-02-13 21:29:04
   Median: 38.36
   Count: 8279
   Std Dev: 3.64
   Range: 66.15

>> Trend Analysis:
   (Trend Analysis compares the 1-day and 7-day averages to indicate short-term changes,
    and shows the deviation of the current reading from the 7-day average.)
   1-day vs 7-day Trend: -0.00%
   Deviation from 7-day Avg: +8.77%

>> Outlier Analysis:
   (Outliers are determined using the Interquartile Range (IQR) method;
    the top 5 worst outliers are listed based on their deviation from the median.)
   Top 5 Worst Outliers:
      1. 96.31 at 2025-02-13 22:24:17
      2. 95.90 at 2025-02-13 22:23:17
      3. 95.22 at 2025-02-13 22:22:17
      4. 95.22 at 2025-02-13 22:25:17
      5. 93.86 at 2025-02-13 22:21:17

======================================================================

######################################################################
>> METRIC: TVOC Index (Index)  [Units: Index]
######################################################################
>> Current Reading:
   Value: 141.62 at 2025-02-16 02:01:47

>> Rolling Averages:
   (The rolling averages represent the mean value of the metric over the last 1 day and 7 days, respectively.)
   1-day Average: 191.20
   7-day Average: 120.61

>> 7-Day Window Statistics:
   (These statistics are computed over the last 7 days of data.)
   Highest: 499.00 at 2025-02-12 23:10:11
   Lowest: 0.00 at 2025-02-09 13:00:33
   Median: 89.00
   Count: 8279
   Std Dev: 93.86
   Range: 499.00

>> Trend Analysis:
   (Trend Analysis compares the 1-day and 7-day averages to indicate short-term changes,
    and shows the deviation of the current reading from the 7-day average.)
   1-day vs 7-day Trend: +58.52%
   Deviation from 7-day Avg: +17.42%

>> Outlier Analysis:
   (Outliers are determined using the Interquartile Range (IQR) method;
    the top 5 worst outliers are listed based on their deviation from the median.)
   Top 5 Worst Outliers:
      1. 499.00 at 2025-02-12 23:10:11
      2. 499.00 at 2025-02-12 23:11:12
      3. 499.00 at 2025-02-12 23:12:11
      4. 499.00 at 2025-02-12 23:13:12
      5. 498.98 at 2025-02-12 23:09:11

======================================================================

######################################################################
>> METRIC: eCO2 (ppm)  [Units: ppm]
######################################################################
>> Current Reading:
   Value: 653.63 at 2025-02-16 02:01:47

>> Rolling Averages:
   (The rolling averages represent the mean value of the metric over the last 1 day and 7 days, respectively.)
   1-day Average: 607.20
   7-day Average: 625.17

>> 7-Day Window Statistics:
   (These statistics are computed over the last 7 days of data.)
   Highest: 879.77 at 2025-02-13 22:23:17
   Lowest: 262.20 at 2025-02-13 21:43:09
   Median: 627.53
   Count: 8279
   Std Dev: 83.48
   Range: 617.57

>> Trend Analysis:
   (Trend Analysis compares the 1-day and 7-day averages to indicate short-term changes,
    and shows the deviation of the current reading from the 7-day average.)
   1-day vs 7-day Trend: -2.87%
   Deviation from 7-day Avg: +4.55%

>> Outlier Analysis:
   (Outliers are determined using the Interquartile Range (IQR) method;
    the top 5 worst outliers are listed based on their deviation from the median.)
   Top 5 Worst Outliers:
      1. 262.20 at 2025-02-13 21:43:09
      2. 347.20 at 2025-02-13 22:00:22
      3. 367.82 at 2025-02-14 02:42:29
      4. 879.77 at 2025-02-13 22:23:17

======================================================================

######################################################################
>> METRIC: PM2.5 (µg/m³)  [Units: µg/m³]
######################################################################
>> Current Reading:
   Value: 10.77 at 2025-02-16 02:01:47

>> Rolling Averages:
   (The rolling averages represent the mean value of the metric over the last 1 day and 7 days, respectively.)
   1-day Average: 8.99
   7-day Average: 5.00

>> 7-Day Window Statistics:
   (These statistics are computed over the last 7 days of data.)
   Highest: 503.89 at 2025-02-10 09:44:05
   Lowest: 0.00 at 2025-02-09 02:01:58
   Median: 3.18
   Count: 8279
   Std Dev: 14.65
   Range: 503.89

>> Trend Analysis:
   (Trend Analysis compares the 1-day and 7-day averages to indicate short-term changes,
    and shows the deviation of the current reading from the 7-day average.)
   1-day vs 7-day Trend: +79.80%
   Deviation from 7-day Avg: +115.33%

>> Outlier Analysis:
   (Outliers are determined using the Interquartile Range (IQR) method;
    the top 5 worst outliers are listed based on their deviation from the median.)
   Top 5 Worst Outliers:
      1. 503.89 at 2025-02-10 09:44:05
      2. 429.62 at 2025-02-10 19:47:56
      3. 423.20 at 2025-02-09 10:58:06
      4. 396.45 at 2025-02-09 13:08:34
      5. 344.07 at 2025-02-09 10:52:04

======================================================================

## TIME-OF-DAY TREND ANALYSIS ##
   (This section provides trend analysis for different parts of the day.)
----------------------------------------------------------------------
[ Night "00:00 - 06:00" ]
   Metric: Temperature (°F)
   1-day vs 7-day Trend: -0.82%
   Deviation from 7-day Avg: -0.06%

   Metric: Relative Humidity (%)
   1-day vs 7-day Trend: -1.00%
   Deviation from 7-day Avg: +2.73%

   Metric: TVOC Index (Index)
   1-day vs 7-day Trend: +20.83%
   Deviation from 7-day Avg: +69.08%

   Metric: eCO2 (ppm)
   1-day vs 7-day Trend: +6.69%
   Deviation from 7-day Avg: +12.33%

   Metric: PM2.5 (µg/m³)
   1-day vs 7-day Trend: +188.00%
   Deviation from 7-day Avg: +174.27%

----------------------------------------------------------------------
[ Morning "06:00 - 12:00" ]
   Metric: Temperature (°F)
   1-day vs 7-day Trend: -3.50%
   Deviation from 7-day Avg: -4.67%

   Metric: Relative Humidity (%)
   1-day vs 7-day Trend: +0.96%
   Deviation from 7-day Avg: +12.12%

   Metric: TVOC Index (Index)
   1-day vs 7-day Trend: +25.76%
   Deviation from 7-day Avg: +30.21%

   Metric: eCO2 (ppm)
   1-day vs 7-day Trend: -10.41%
   Deviation from 7-day Avg: +10.06%

   Metric: PM2.5 (µg/m³)
   1-day vs 7-day Trend: +64.91%
   Deviation from 7-day Avg: +134.63%

----------------------------------------------------------------------
[ Afternoon "12:00 - 18:00" ]
   Metric: Temperature (°F)
   1-day vs 7-day Trend: -6.01%
   Deviation from 7-day Avg: -10.06%

   Metric: Relative Humidity (%)
   1-day vs 7-day Trend: +3.43%
   Deviation from 7-day Avg: +18.15%

   Metric: TVOC Index (Index)
   1-day vs 7-day Trend: +69.09%
   Deviation from 7-day Avg: +5.85%

   Metric: eCO2 (ppm)
   1-day vs 7-day Trend: -11.04%
   Deviation from 7-day Avg: -0.75%

   Metric: PM2.5 (µg/m³)
   1-day vs 7-day Trend: +54.56%
   Deviation from 7-day Avg: +98.19%

----------------------------------------------------------------------
[ Evening "18:00 - 23:59" ]
   Metric: Temperature (°F)
   1-day vs 7-day Trend: +0.22%
   Deviation from 7-day Avg: -2.75%

   Metric: Relative Humidity (%)
   1-day vs 7-day Trend: -2.17%
   Deviation from 7-day Avg: +4.26%

   Metric: TVOC Index (Index)
   1-day vs 7-day Trend: +87.73%
   Deviation from 7-day Avg: -11.64%

   Metric: eCO2 (ppm)
   1-day vs 7-day Trend: +2.66%
   Deviation from 7-day Avg: -2.89%

   Metric: PM2.5 (µg/m³)
   1-day vs 7-day Trend: +40.86%
   Deviation from 7-day Avg: +74.21%

----------------------------------------------------------------------
======================================================================