AirGradient Forum

The SGP41 Detects NOx Events, But Can You Trust the Number?

The SGP41 is a small MOX (metal oxide) gas sensor from Sensirion that puts out two air quality signals, one for VOCs and one for NOx. We use it inside our AirGradient monitors (everything from the ONE to the Go), so understanding how far its NOx reading can be trusted was something we wanted to better understand. We've already put the VOC side through its own testing (results can be read here), and today we want to turn to the NOx half. In this article, we will look at controlled, indoor performance and in an upcoming article, we will take a deeper look at outdoor performance.


This is a companion discussion topic for the original entry at https://www.airgradient.com/blog/sgp41-indoor-performance

love how dedicated y’all are to rigorous testing and developing a better product than sensor manufacturers alone can offer.

a few questions: if the raw data appears to lag the reference levels, which could be considered better than the sharp decline of the index number, would it not be better to have monitors show raw numbers rather than index? to error on the side of safety?

i’m not seeing a raw option for NOx on the dashboard. but could that be an option in the future?

lastly, do different Index Learning Time Offset Durations have any impact on the index numbers tracking of the reference? from the graphs above, it seems the algorithm is very responsive, and quickly heads back down to 0. perhaps lengthening that offset time would slow that trend?

I appreciate the comprehensive testing of the SGP41 sensor and posting of the results. I agree that the sensor effectively becomes nose-blind to ambient gas concentrations with the shifting baseline so that the effect could be that the sensor reports lower levels than are present. This compromises the utility of the sensor and suggests to me that some thought needs to go into reporting raw numbers so that users have the ability to see detection events and compare those events to the reported values to better understand whether they can trust the sensor data in their own situation.

In one sense it is obvious that the moving average employed distorts the reported data enough to make it unusable in some situations. Employing a longer moving average smooths the output too much as is evident in the long duration data stream that missed the roll-off of the actual event. A shorter moving average would be more appropriate but no matter how it is handled, the baseline is a moving target and that is the biggest issue.

Hi @wsm and @Flatspot,

Firstly, thank you both for the feedback on the article! It was quite an interesting one to write.

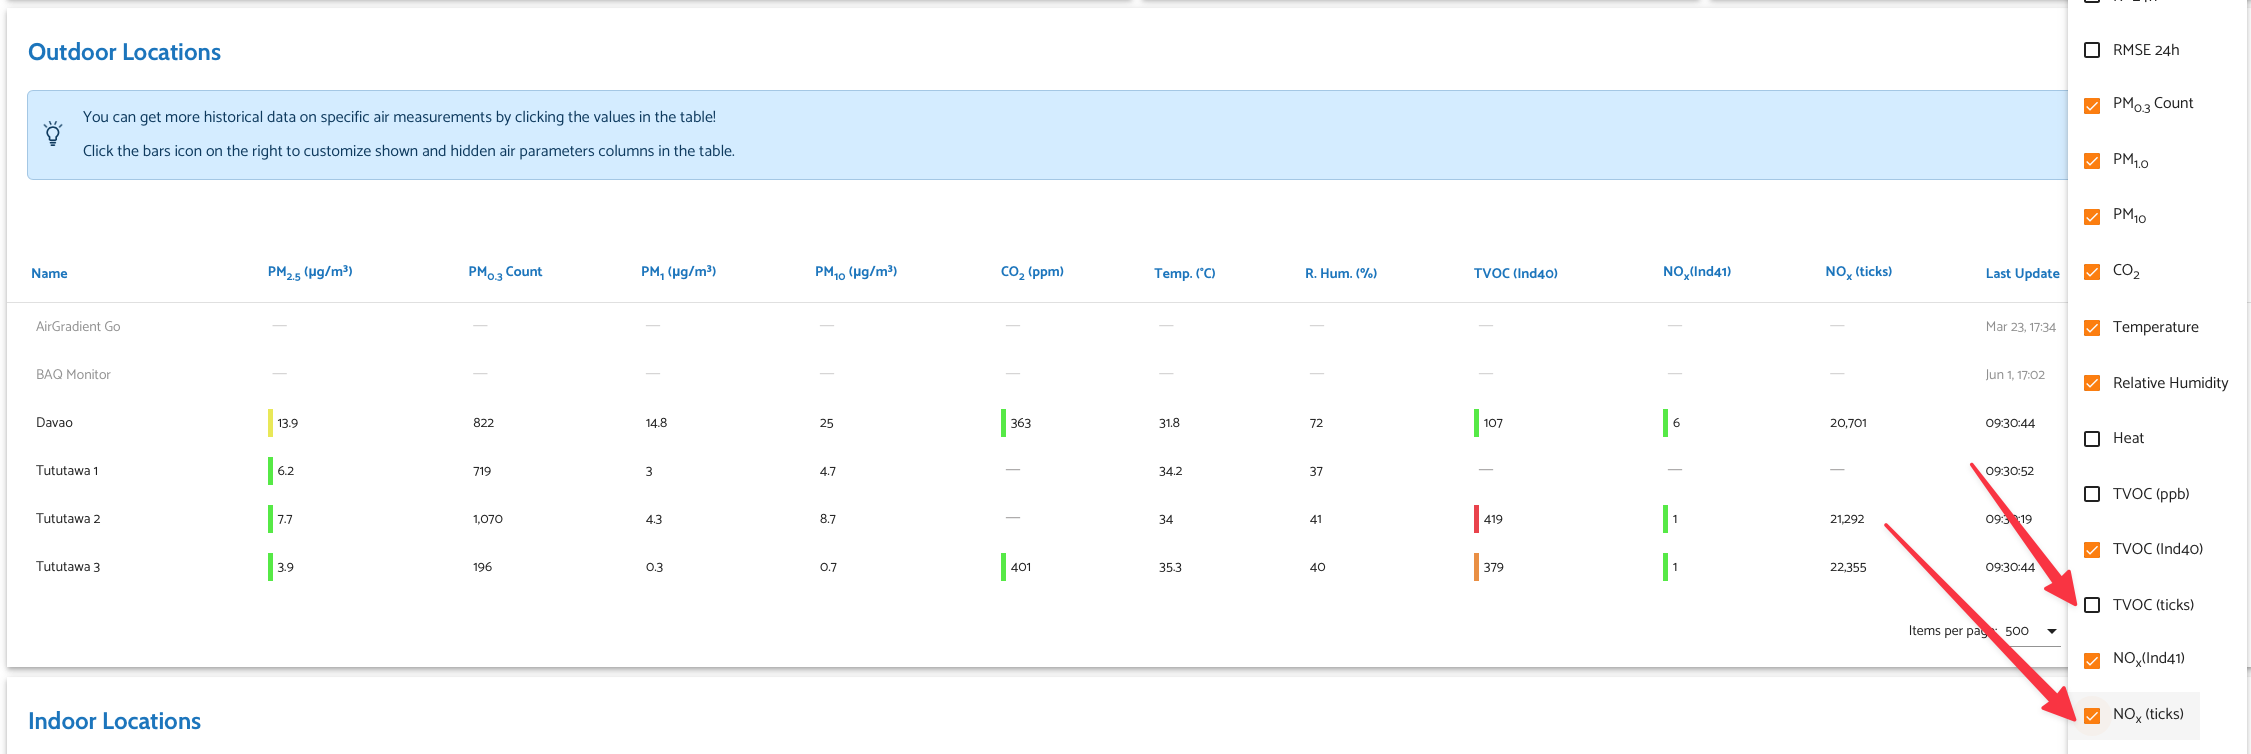
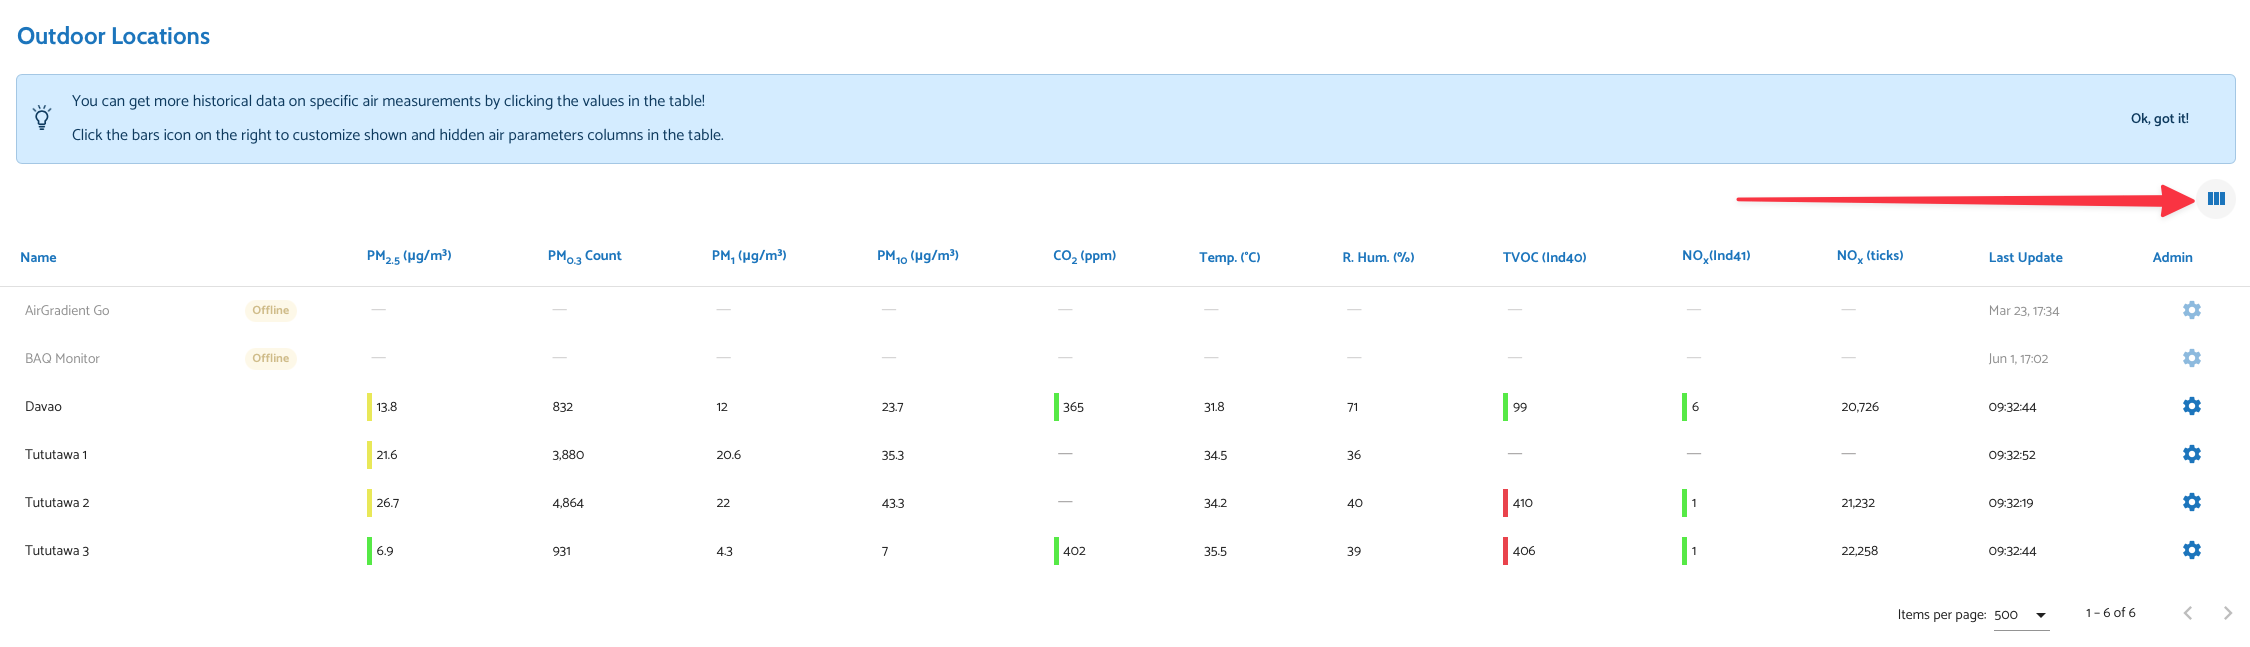
You can enable ‘ticks’ (the raw output from the sensor) on the dashboard. You just need to ensure you have ‘Advanced Settings’ enabled. You can find this tick box right at the bottom of the ‘General Settings’ tab. Once you’ve ticked the box, go back to the homepage and click the three bars and tick ‘NOx ticks’:


With this said, I do again want to emphasise why we don’t show ticks by default, because they can lead to a lot of confusion.

The issue with the raw ticks is that they use a scale of 0-65,535, proportional to log resistance. This means that the raw output isn’t a concentration, and has no fixed relationship to ppb. The baseline resistance also drifts as the sensor ages and shifts with temperature and humidity, so the same tick value doesn’t necessarily mean the same thing on your monitor next month as it does today, let alone on someone else’s monitor. On top of this, it’s just a very confusing metric to understand:

  • The VOC and NOx ticks move in opposite directions. NOx is oxidising, so resistance and ticks rise as NO2 rises. VOCs are reducing, so resistance and ticks fall as VOC concentration rises. If you enable both, you’ll be looking at one number where up means worse and one where down means worse. Make sure to keep this in mind.
  • Equal steps aren’t equal amounts. Because the signal follows log resistance, the same tick increase means the same multiplication regardless of where it is on the scale. A rise from 20 to 40 ppb looks identical on screen to a rise from 200 to 400 ppb, even though the second one is ten times the increase in NO2. It also means the trace flattens out where concentrations are highest.
  • Since there is no fixed link to ppb, nobody can create any thresholds. If someone asks ‘is 24,500 ticks an acceptable level?’, we have no way to answer without also knowing the recent history of that sensor.

Regarding the different baseline learning durations, I think you both would find this interesting: Understanding VOC Index: What Happens When You Change the Learning Period - Air Quality Monitors - CleanAir Community. It discusses the VOC index, so the baseline behaviour should carry over, but bear in mind the NOx index has no gain adaptation the way the VOC index does, so that part won’t apply.

Please let me know if you have any further questions!
Thanks for the reply Ethan. I’m doing a bit of a deep dive right now on all these sensors. I already display the ticks for TVOC and NOx on my personal dashboard because by nature I am a button-pusher and I found them a long time ago. Interesting stuff.

Thank you all for the discussion here. Please feel free to let us know if you have any further questions.

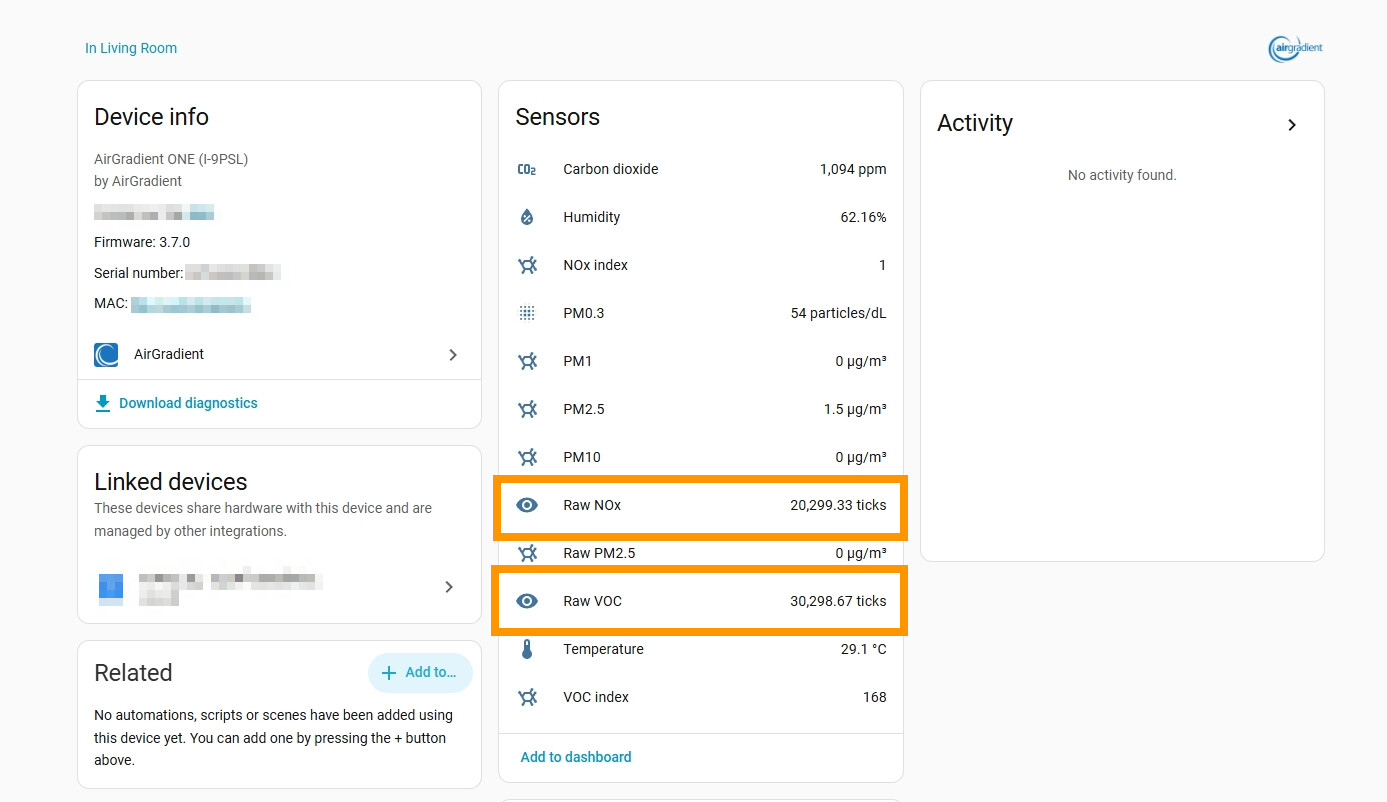
Additionally, in case you’re wondering, the raw NOx and raw VOC in ticks are also available to display in Home Assistant (as well as other data platforms when you get the data from the monitor’s local API). So you don’t strictly need the AirGradient Dashboard to see these raw readings.