AirGradient Forum

Historical data and calibration change

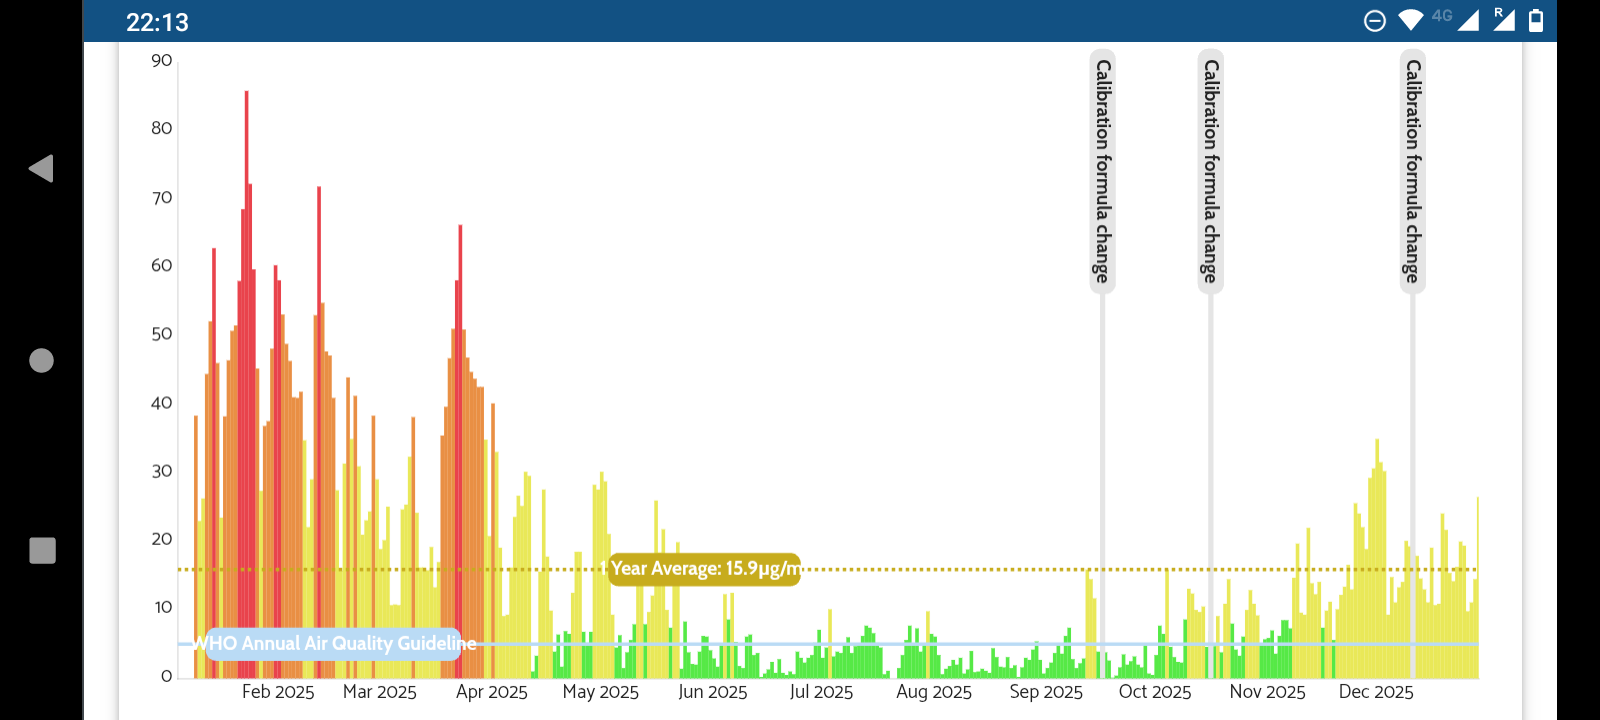
Please see attached a screenshot of my outdoor data for the last year. As you can see I applied the US EPA calibration three times (Only the first calibration change in September was an actual change, the other two I toggled back and forth between calibrated or not, so actually no significant uncalibrated data would have been saved in the interim).

My questions, does the calibration apply retrospectively?

Or is all the data to the left of the first calibration uncalibrated?

Do I actually have two different scales of data on my chart (pre and post Sept) or just one?

Thank you.

Further to this, when I installed the Airgradient app on my new phone a week ago, I was prompted to select a calibration PMS5003_20240104. I had never seen this message before on my old phone, my sensor has been running since January 2025. Anyway I ticked yes, this seemed to remove EPA calibration because my dashboard readings were much lower than on the map. I then re-checked ‘apply EPA formula’.

However, I’ve noticed that the readings on the AirGradient map are still lower than on my dashboard, suggesting that my dashboard is NOT applying the EPA formula. Is this correct?

I’m just very confused about the new PMS calibration and what it means, and why there is now a mismatch between my dashboard (which should be applying EPA formula) and the map.

And returning to my original question, how do I interpret the historical data with all these calibration changes? Is the data retrospectively calibrated (for EPA only, or also now with the PMS)?

Thanks.

Hi @Bangkokdi,

Currently the calibrations do not apply retroactively, which is why we show clearly when the corrections/calibrations were changed. I will see if there’s a technical reason behind this and if it’s something we can change going forward, but please know that, for the moment, changes only apply going forward.

This likely stems from the fact that, at the moment, data submitted to the map is not batch-corrected, but it does have the EPA correction applied. In other words, what you see on your dashboard is data that is batch-corrected + EPA corrected (if the box in the image below is ticked) and on the map you see data that is only EPA corrected. Please know that we are looking into making the readings more consistent and in bringing the other corrections to map data.

You can check if the batch correction & EPA correction are applied by going to ‘Advanced settings’. You can find this under the ‘Admin’ menu for the monitor:

Thanks Ethan, here are my settings in my dashboard.


So, since the readings on the Airgradient map are lower, does that mean that the map doesn’t apply the PMS formula, only EPA, and therefore what PMS effectively does is making my readings slightly higher than if only EPA applied? (I’m talking about PM2.5 readings in the range of 10-25 which are lower on the map than on my dashboard).