I just wanted to congratulate the AirGradient team on the app they recently released. It’s really, really well done!
2 Likes
Thank you for the feedback @earnerd! We really appreciate it!
Is there anything you would like to see improved or added? 
One thing I noticed is that, within a location, the PM2.5 over time figure for 180 days does not plot correctly. It does not plot the last 6 months of data.
A couple of other small things come to mind, like dark mode, a smaller widget, and the ability to also arrange locations manually.
1 Like
I’ve only just started using the app. It’s very personal, but I really don’t like the graphics. I regard the function as scientific and the UI looks childish and thus inappropriate to my eyes, just my opinion. For functionality, I really value being able to compare data to other benchmarks, so the comparison monitor feature is great from my perspective. However, unlike comparisons set on the dashboard, the app requires one to set it on every use; if it remembered this setting it would be more convenient.
1 Like
I have to agree. The graphics look more like a Japanese kids game or cartoon, and the inclusion of spam, ads (even if for yourselves) and anything other than just monitor data made it a deal breaker (andthing mentioning “recommendations” is promising “spam” and I found no means to disable that nonsense). It’s already been deinstalled, as it appears to offer nothing of value beyond the web based dashboard, but a far, far, larger footprint.
Good concept, just needs work.
1 Like
Hi @Tim_Bee & @tadawson, thank you so much for your honest feedback.
Currently, the dashboard remains far more powerful for scientific purposes. The app serves as an easy way for general users to quickly see the air quality data and to create awareness about air quality for the general public.
Anyway, that could be great if the app serves both audiences effectively. Your thoughts are noted. I’ll bring this up with our development team as we are constantly improving our mobile app.
Please feel free to share more opinions. That will be really helpful for us to know what our users are looking for. Thanks!
Some quick feedback:
- Would love a way to reorder the locations/sensors being monitored. Right now it appears to be in the order they were added, with no way to reorder.
- Would be nice if the sensors being monitored show a general location next to the readings or under the name in the app list of favorited sensors, not just the name of the sensor. Some of the sensors have names like “Jojo” that do not indicate a location and then there’s no way to search except by map so if you’ve favorited a location named like that and you’ve forgotten where it is…
1 Like
@vlotty Solid points! Thank you for your suggestion with such a clear explanation. Let me pass this on to our app developer.
Feel free to give us any feedback. Thanks again!
Some more feedback after the wildfire smoke from Canada!
- Perhaps offer a way to display the average of a selected number of sensors for a given general location? And/or have this available to select as what the widget displays? (Some of the sensors were either way off, or they stopped reporting data)
- As far as reporting data, several of my favorited local sensors just… stopped reporting new data? Maybe the super high levels of PM damaged their sensors or broke their reporting link somehow. Like the last time they reported as days ago, and the app either shows the last reported value (which now is not correct), OR it says “0.0 ug/m3”, also incorrect. If a sensor is not reporting a value reported in the last X hours I think it should not show “green” or whatever the corresponding color, it should show “offline” maybe grayed out.
1 Like
Hi again, @vlotty!. Thanks for your feedback.
Could you please confirm if I understand your suggestion correctly?
For point number 1, you would like to see a feature that allows users to select multiple air monitors (and display their average) for a given ‘general location’. The ‘general location’ means a town, city, municipality, etc.
2. You would like to see a more explicit indication (grayed out/an explicit ‘offline’ label) when your favorited (bookmarked) locations turn offline or report outdated readings.
Please feel free to let me know if there’s something I misunderstood in your feedback. Thanks again!
1 Like
Yes, you understand my suggestions correctly, thank you.
1 Like
Thank you for the confirmation. Let me add these to our feature request list.
Once again, thank you so much for your feedback. And please feel free to let us know if you have any other feedback in the future.
I really appreciate that the iOS app allows me to pin a couple of local outdoor monitors that are less than a couple miles away from my home with its indoor monitor. Can’t do this in the web browser desktop as far as I can tell.
This was super helpful during the wildfires in Canada last week. I noticed my indoor air quality improving while the Apple Weather reported outdoor air quality hadn’t changed at all, and I’ve noticed that disparity happening before. This time, I could see that the two closest monitors were also showing that outdoor air quality had improved.
What does this mean? I trust Airgradient sourced data, for my location at least, more than what I get from Apple (which is third party and who knows how they calculate, update or QC it).
1 Like
@makingmark thanks again for your feedback! And glad to hear that our AirGradient app was helpful during the wildfire.
The AirGradient Map mobile app allows users to bookmark other locations (that are not owned by that user) which is very handy. This same feature hasn’t been implemented on the web dashboard. However, I can discuss with the team and add this to our feature request list.
Thank you once again for your feedback!
1 Like
I love the app! However on the large widget id like to see more information at a glance! Like temperature, humidity, etc. maybe in the spot I circled. Great work though, love it!
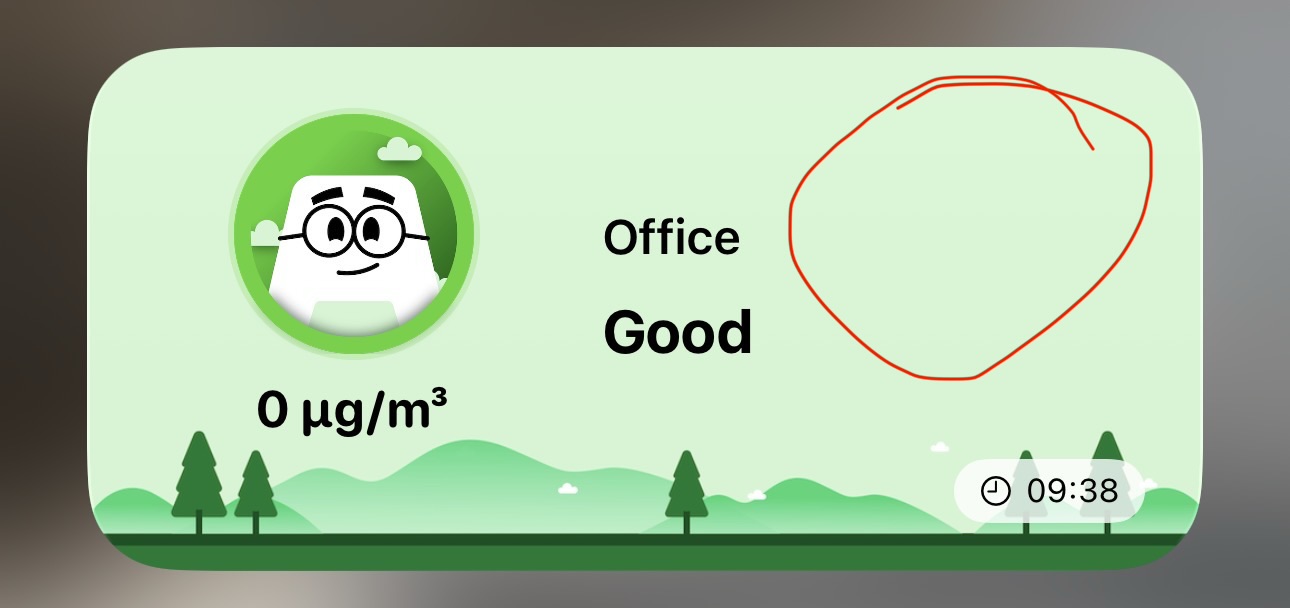
1 Like
Hi @Brand, welcome to our community! Thank you for your feedback. Let me bring this up in our next team meeting!