The guides are both clear and visually appealing. Looking forward and thanks for sharing.
Thanks @Ramon! These are still the first versions, we look forward to improving them with everyone’s feedback!
1 Like
Hi Tai, when it ships will we receive an email notification, to know to expect it? Am going to be traveling a fair bit in the next few weeks so would be good to be warned in advance that a package will be arriving. Thanks!
1 Like
Hi again @Bangkokdi! Yes, we will notify you as soon as your AirGradient Go order is shipped. Hope you’ll have a cool trip!
1 Like
Have you got your order? Ordered mine in March 18 but still haven’t received it.
Hi all,
Sharing my experience: Ordered on March 13, parcel arrived at customs office on July 31. Receive the parcel on August 11.
Shipping destination Bulgaria.
Regards
Hi everyone, and welcome @lephunghien and @krasi2001ivanov to our community.
I would like to inform you that another new batch of the AirGradient Go is being assembled and will be tested in our test chamber. The production team has confirmed with me that our production capacity has been improving, and issues that caused the delay in the first batch should now be resolved.
We are once again sorry for the delay, and thank you for your understanding. We will notify you as soon as your order is ready.
1 Like
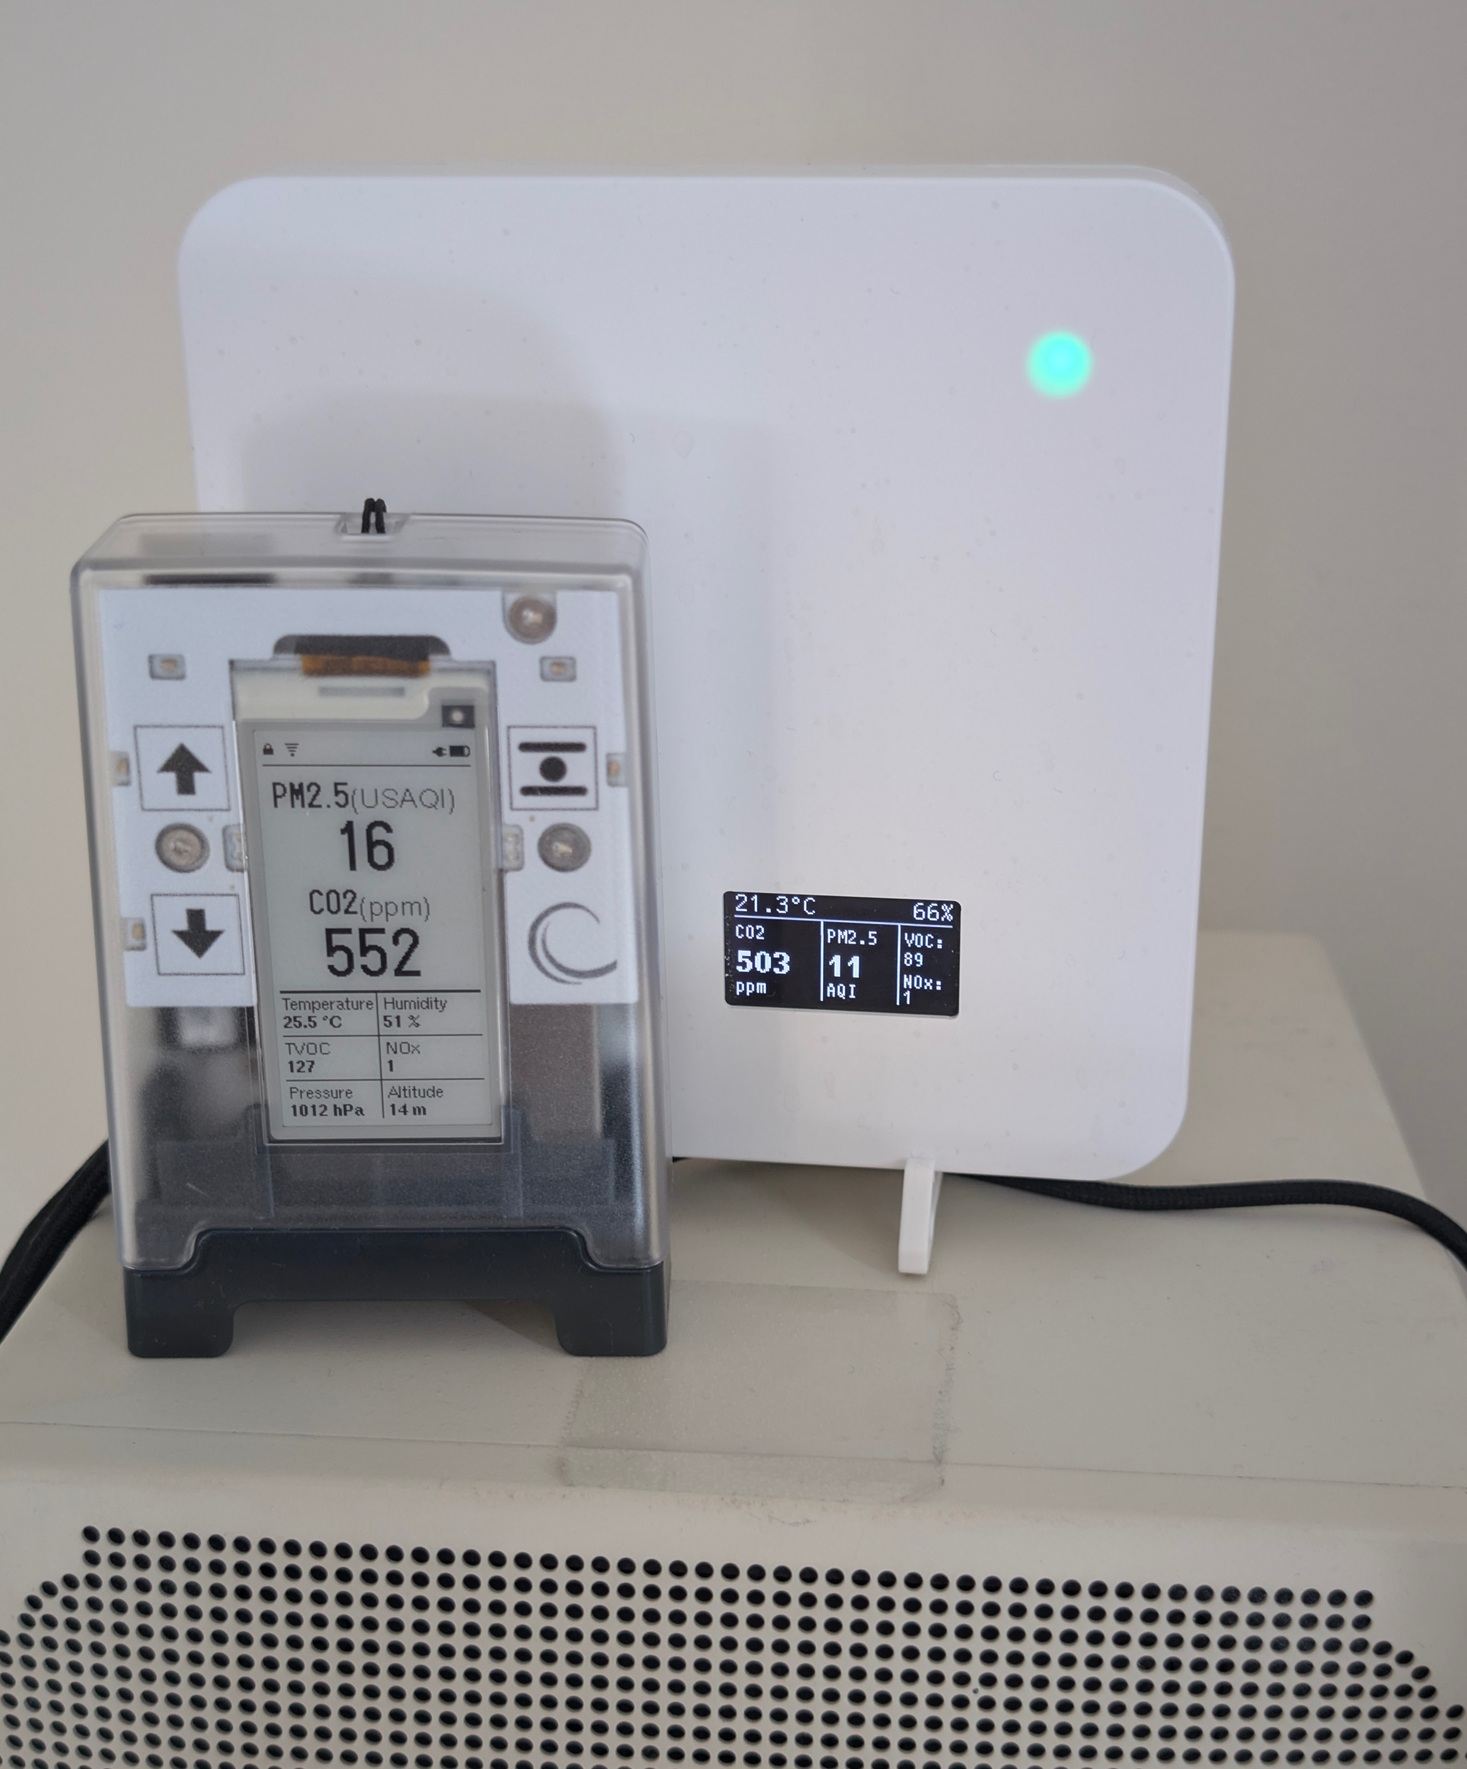
Seems I’m amongst the first to receive their AirGradient Go! Here’s mine running in stationary mode in Vancouver, B.C. next to my AirGradient ONE. I’ve managed to get it on WIFI and Bluetooth, though I’ve not yet taken it mobile or tried GPS. I’m collecting comments/feedback for AG if such an opportunity presents.
4 Likes
mine arrived yesterday!
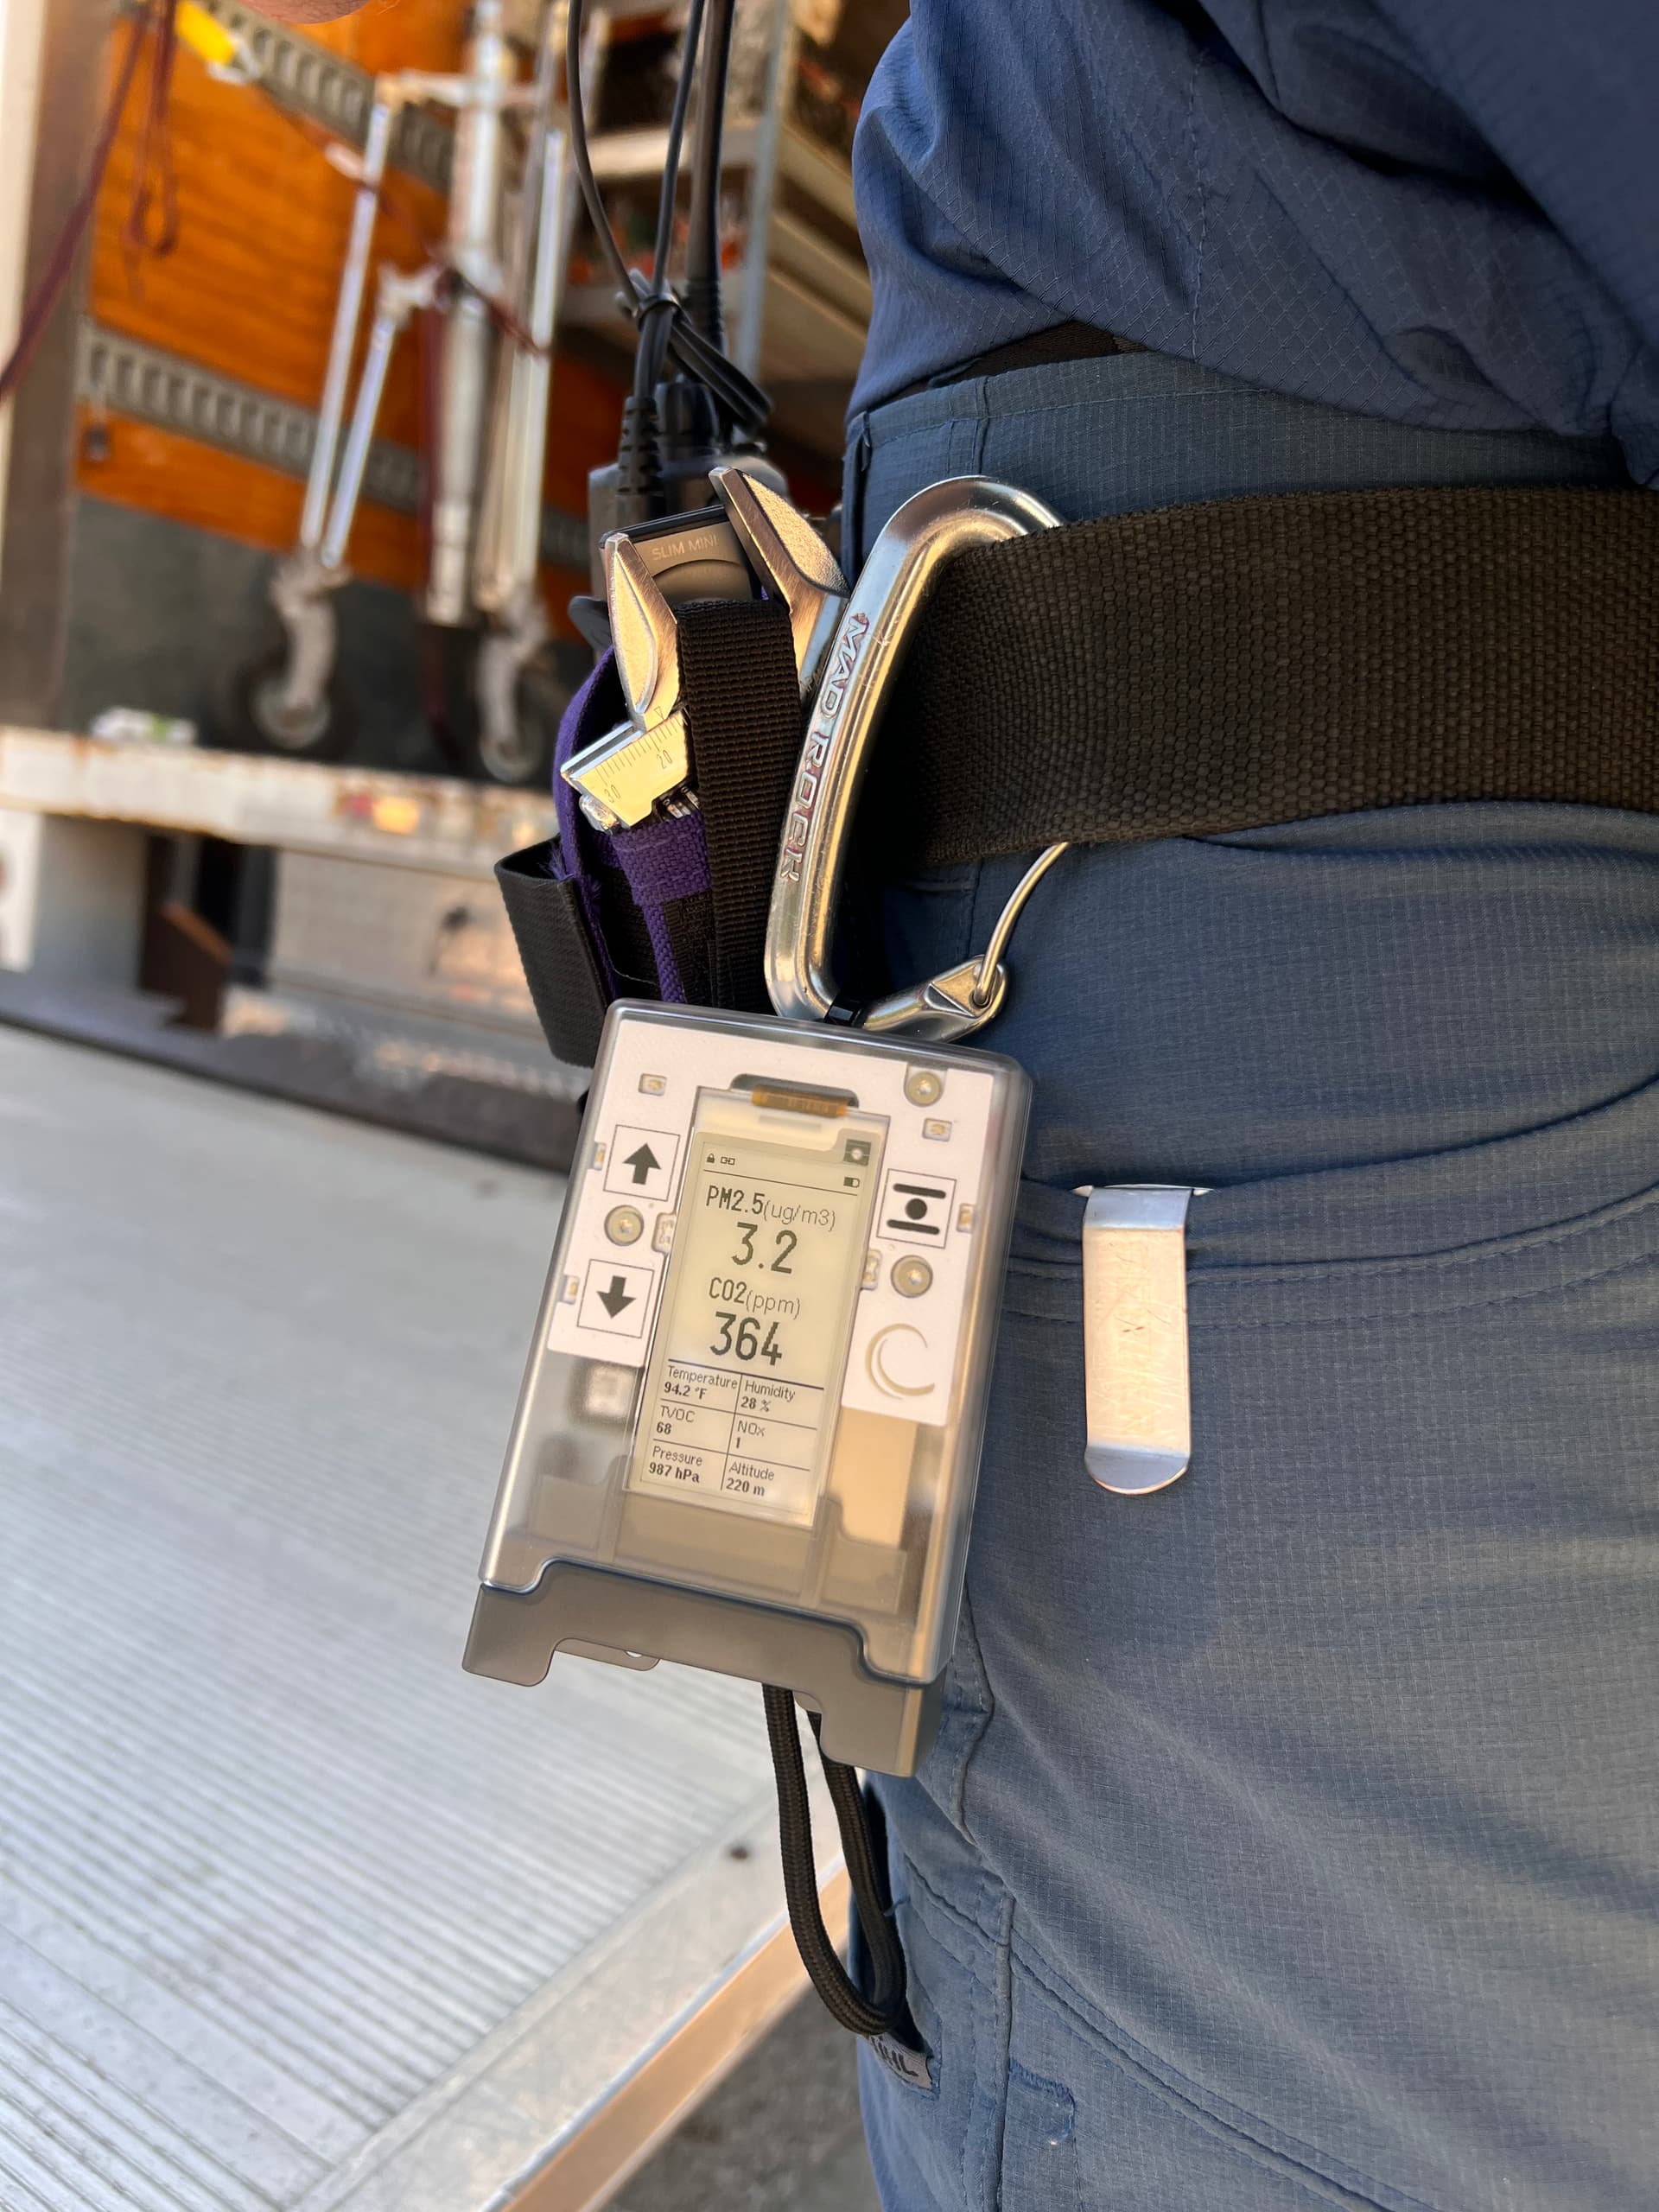
took it to work, got it running in portable mode and immediately clipped it to my work belt.
already seeing some powerful insights to AQ. in a shuttle van, CO2 was above 2400ppm! it was a newer vehicle, and tVOC was maxing out at 500.
watched it go from ~1100 CO2 to over 2000 while working in a house with about thirty other people. i could watch it rise and fall with the rise and fall of activity in the main room we were working in. very cool!
was SUPER easy to setup and get running on the app.
and gotta say, i was expecting it to be larger. but it has a great form factor, and feels solid. not at all worried about carrying it on my tool belt and knocking it around.
great work AirGradient team!
but a couple things i am still trying to figure out / feedback:
-
i’m not seeing any graphs in the app, just live readout. EDIT - found it! you have to tap on the monitor in the My Monitors view on the app, then there are a whole bunch of nicely done visuals!
-
the display on the device doesn’t seem show graphs for tVOC, NOx, Pressure, Altitude.
-
what’s the time frame of the graphs displayed on the device?
-
what is the time frame for the min / max values as you cycle through the measurements on the device?
3 Likes
Awesome info - thanks!!
Will my reply here automatically have me follow this thread?
(New to the forum; unsure of how to follow a thread) thx
Hi @aqiguy! How did you find the setup experience overall? Was the documentation easy to follow, or did you come across anything that could be clearer or improved?
Thanks for the detailed feedback @wsm! And for the awesome photo!
How did you find the setup documentation overall? Was it easy to follow, or was there anything missing or unclear that we could improve?
Regarding the graphs in the app, the app does not currently store and display full historical graphs on the smartphone. In the app, you can view historical data only when the monitor is configured to send data to the AirGradient servers, or when you record a route during portable use.
You are also correct that the device currently does not show graphs for TVOC, NOx, pressure, or altitude. I’ll check with the team on the exact reason. For TVOC and NOx, it may be related to these being relative index values rather than absolute concentration measurements. I’m not yet sure about pressure and altitude.
How have you found the altitude measurement so far? Has it seemed reasonably accurate in your testing?
For the graphs that are shown on the device, the time span depends on the measurement interval. From what I can see in the firmware repo it should be approximately:
| Measurement interval | Graph covers roughly |
|---|---|
| 3 seconds | 45 seconds |
| 10 seconds, default | 2.5 minutes |
| 30 seconds | 7.5 minutes |
| 60 seconds | 15 minutes |
| 5 minutes | 75 minutes |
| 15 minutes | 3 hours 45 minutes |
| 1 hour | 15 hours |
I’d like to confirm this with the team, along with how the min/max period is calculated, so please treat this answer as incomplete for now. I will update this tomorrow if needed.
1 Like
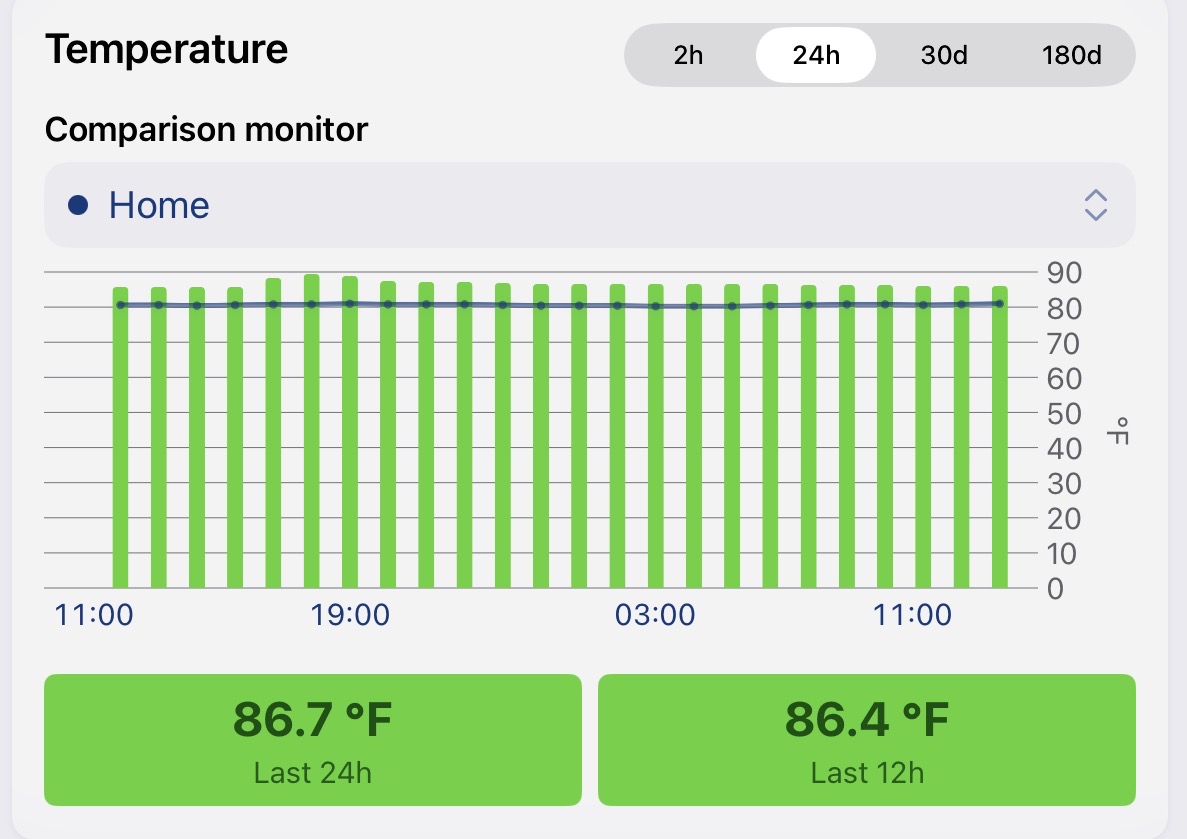
Can you point me to calibration procedures for each sensor in the GO? Temperature is reading 4C+ higher than AG ONE. The other GO sensors seem mis/un-calibrated as well, but not as much. Seems the GO should have shipped already calibrated?
1 Like
Hi @aqiguy, currently, the temperature offset is in the development phase. We will let you know when it is ready.
However, there is still a way to manually set an offset via the local API (but I don’t think this is ideal for users).
For AirGradient Go running on firmware V1.1.0, you can change temperature and humidity calibration settings by running the AirGradient Go in Stationary Mode (Wi-Fi): Connect AirGradient Go to WiFi | AirGradient Knowledge Base and PUT configuration to its local API (using tools like Postman, Bruno, Yaak, or system’s curl command): http://airgradient_SERIALNUMBER.local/api/v1/config
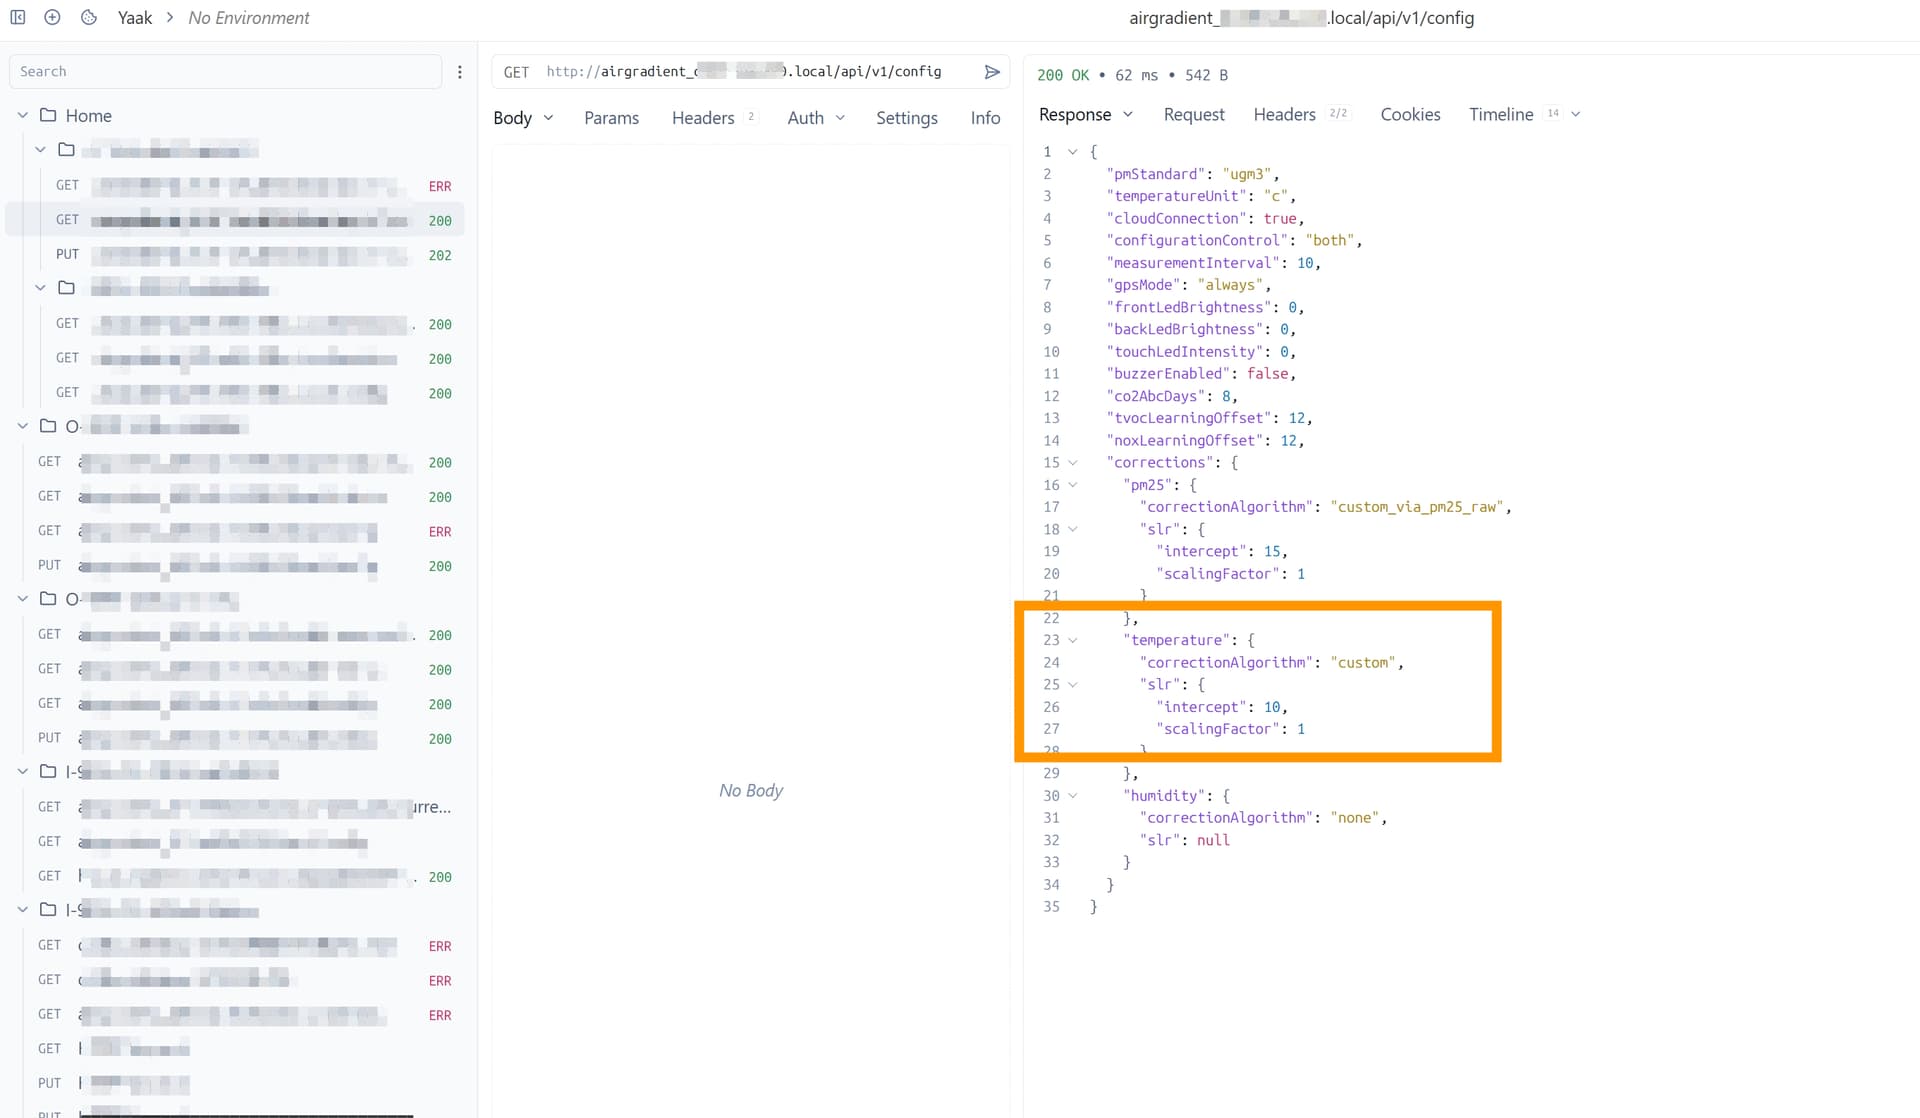
Please note that you should be able to change these settings easily via the AirGradient Dashboard, however, for now, the manual temperature offset made on the Dashboard won’t take effect on the AirGradient Go (PM2.5 offset works anyway). I will discuss this with my team to make it more convenient.
I think sensors like these should be built in to something like the access points at an office. That way you could also monitor your workplace and even adjust ventilation accordingly.
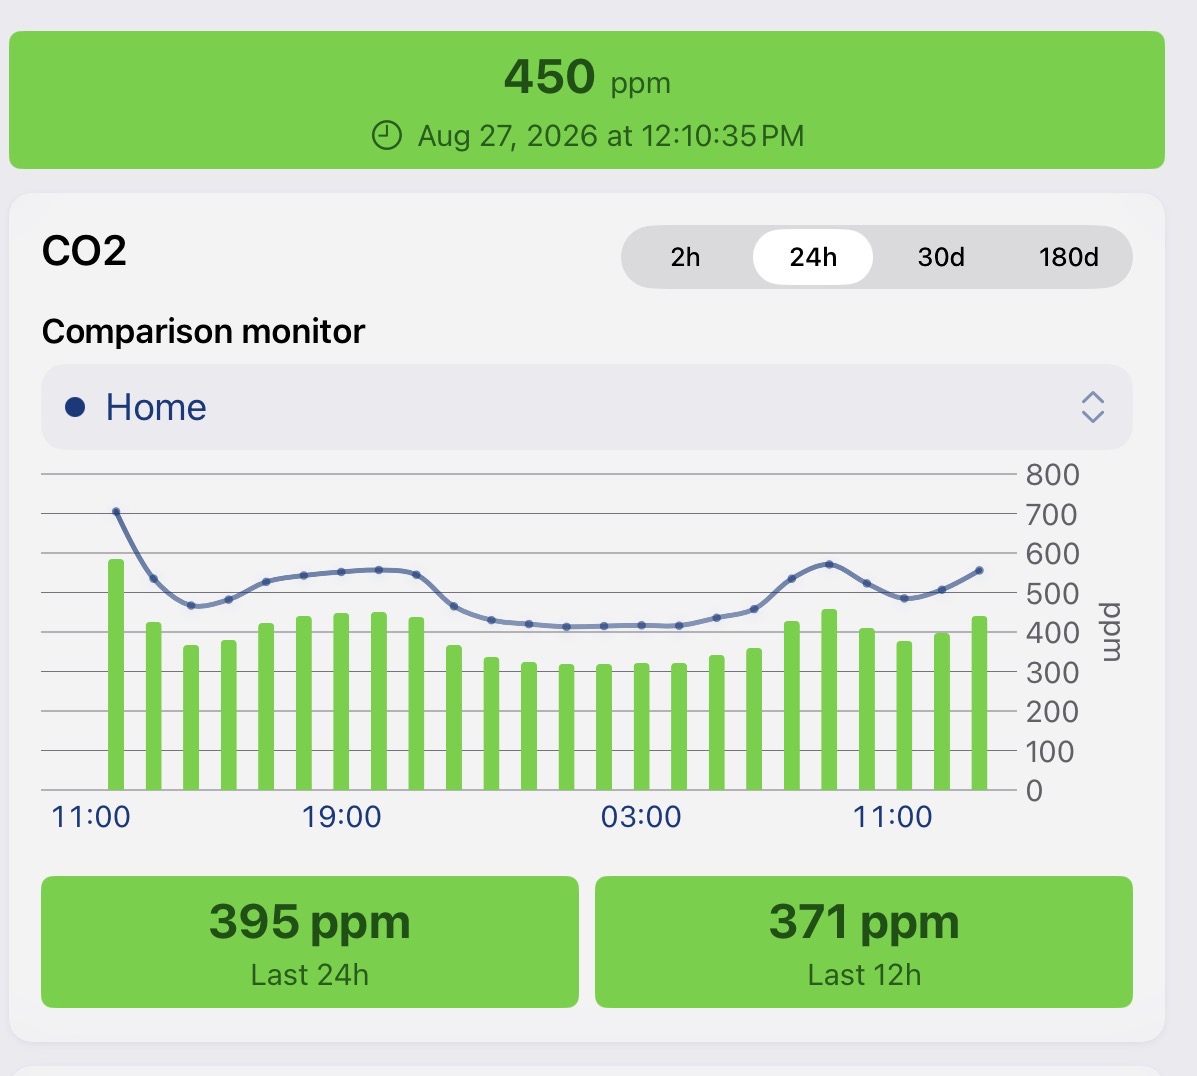
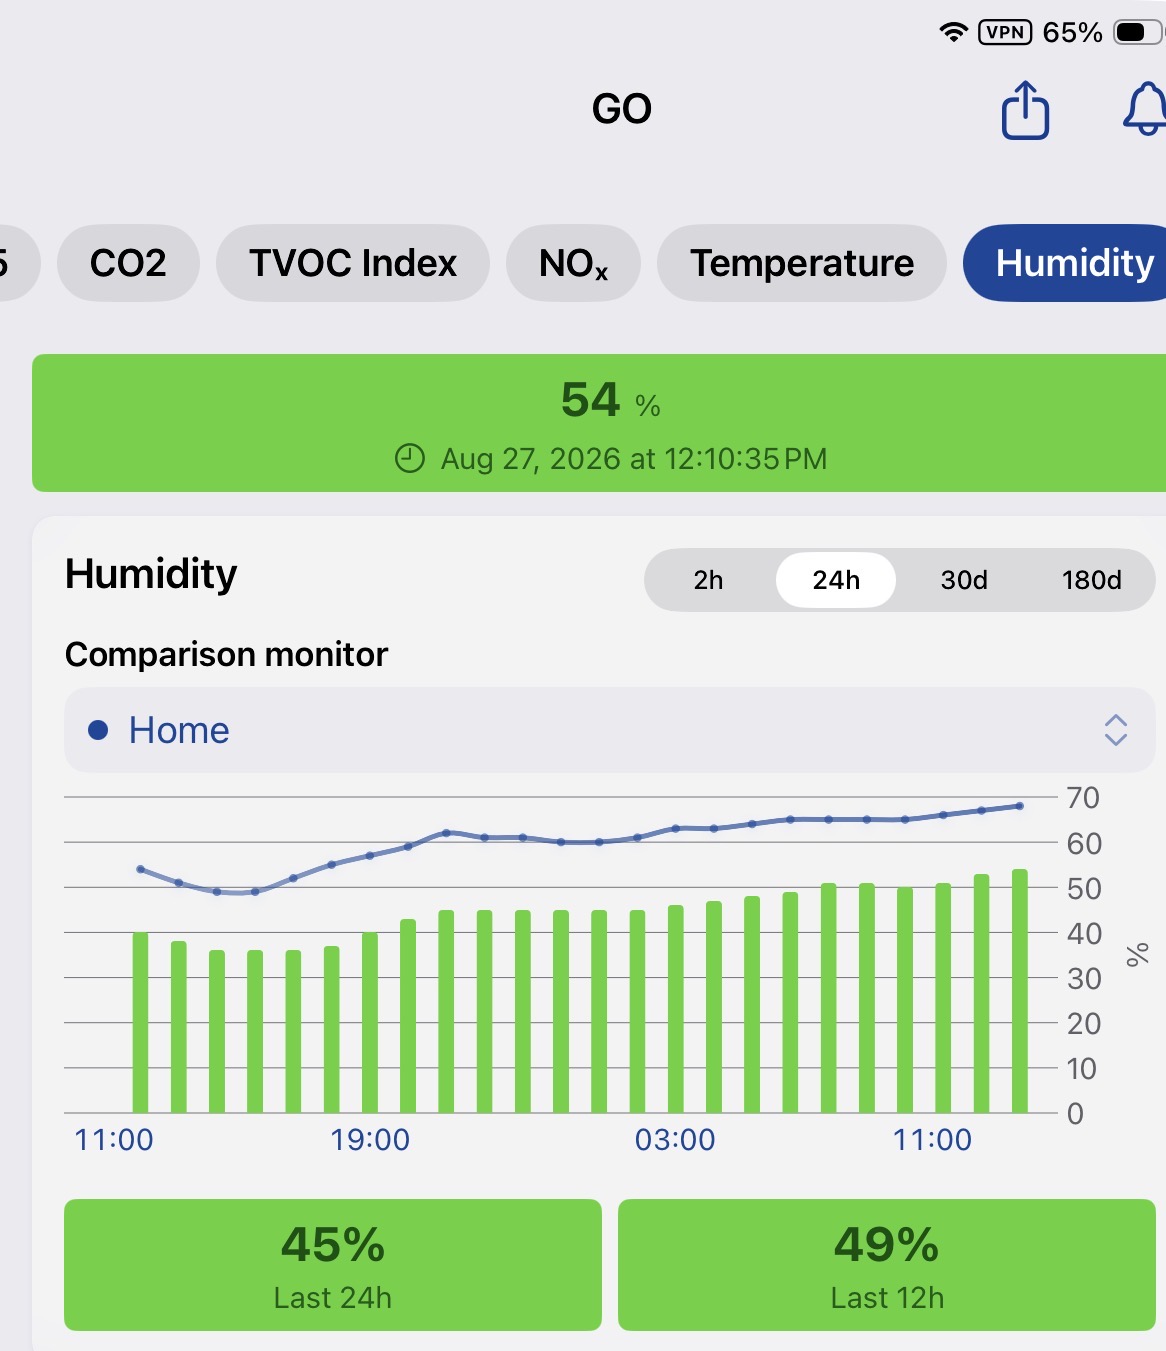
I am uploading graphs comparing readings of GO (green bars) to ONE (blue line).
The readings in each case are strongly correlated but need an offset applied to get them to agree. Should i try do do this or will there be a firmware update that makes these adjustments?
The PM2.5 numbers are pretty much in agreement. The one problem is that the number displayed on the monitor is not correct.
1 Like
Hi @chris_bernhardt, thank you for providing detailed info.
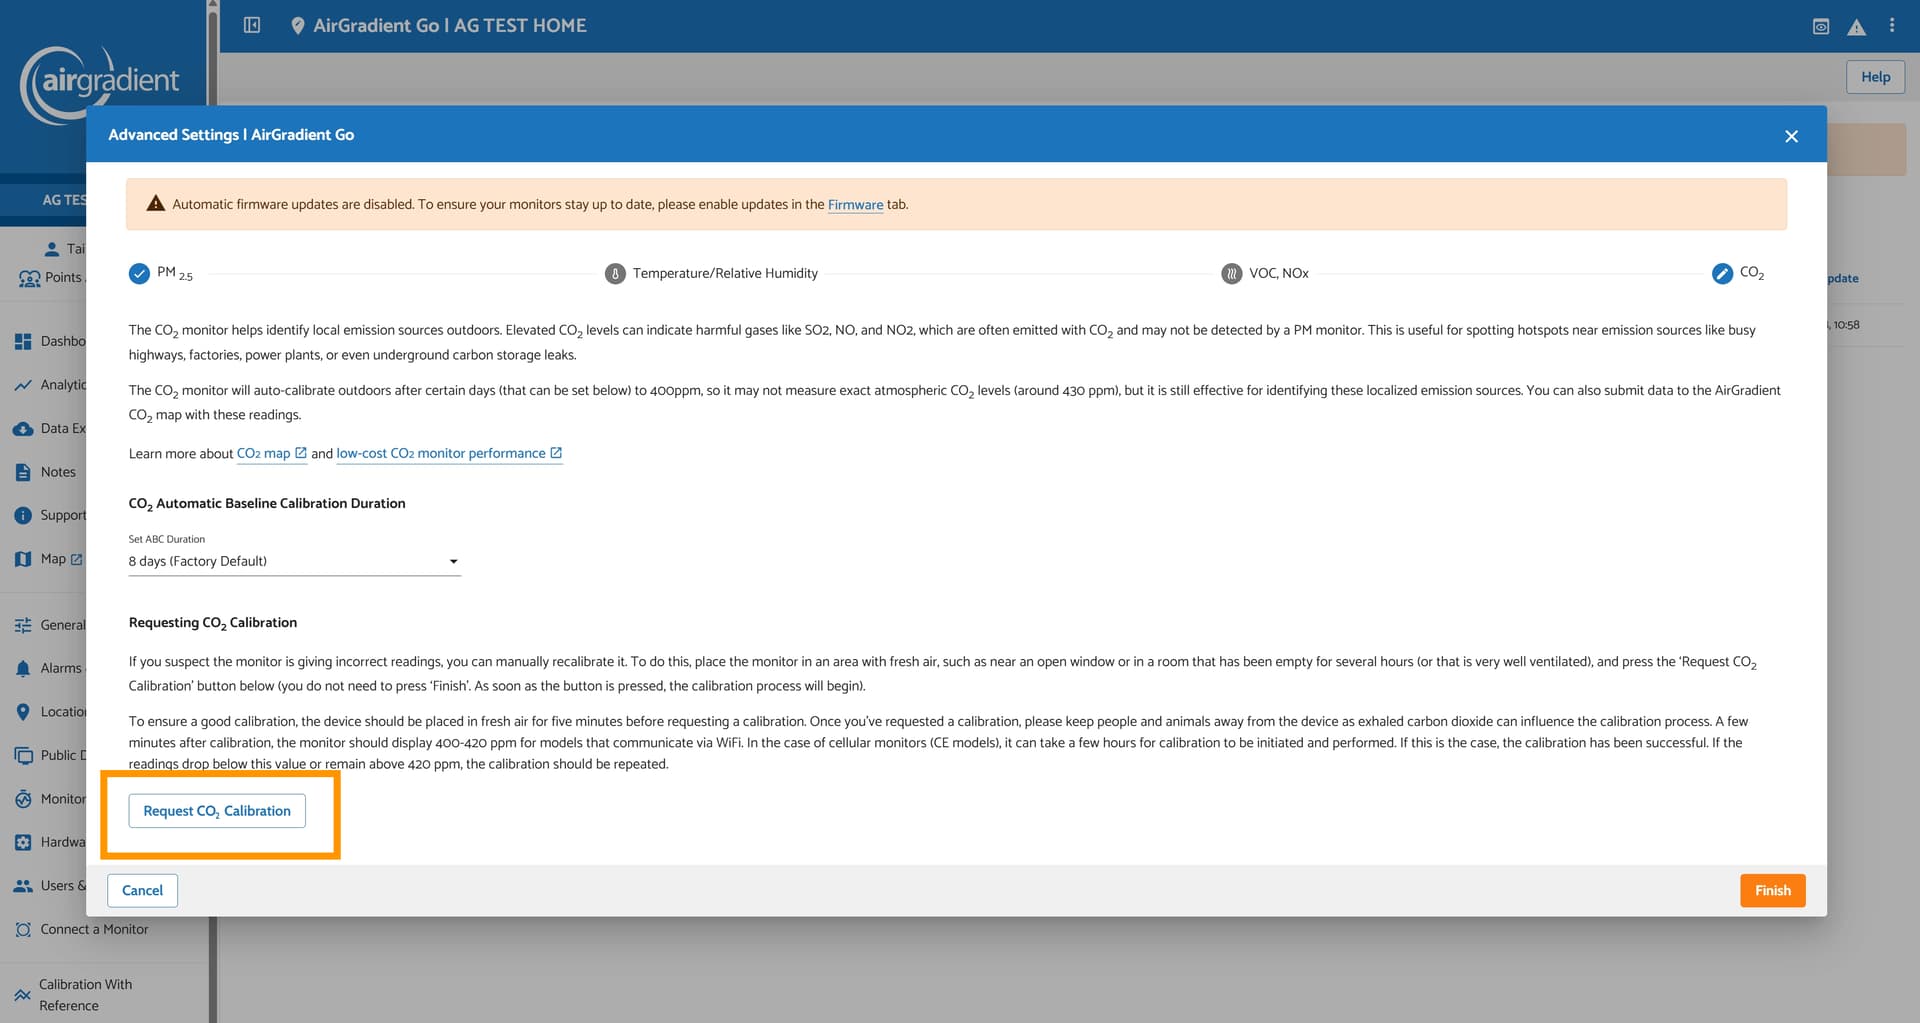
For the CO2 reading, you can place both of your air monitors (Go and ONE) outside, exposed to fresh air, and then perform a manual CO2 calibration for both monitors. Please see this article for more details: Carbon Dioxide (CO2) Sensor Calibration Guide | AirGradient Knowledge Base and discussion on this thread can also be helpful for you: Differences between uncalibrated sources - #2 by Tai_AirGradient
For the temperature and humidity readings, the offset is in development. We will update as soon as we have it ready.
Regarding the difference in PM2.5 numbers displayed on the e-ink display of the monitor VS the AirGradient Dashboard/mobile app, I have observed this with my AirGradient Go and consulted our engineer. This can be caused by differences in the reported time.
The AirGradient Dashboard/AirGradient Map mobile app updates the reading every 60 seconds (the reading you see on the Dashboard/mobile app is the latest reading that the AirGradient Go posts to our server, not an average value.
The E-paper display on the AirGradient Go has an update interval as fast as 3 seconds (the measurement interval can be set in the AirGradient Go’s settings).
1 Like
I am pretty sure the number displayed on GO cannot be explained by differences in time. Posting picture of GO displaying 3.9. and last 24 hour uploaded figures. The amount on displayed on the monitor is consistently wrong and about half the amount given by the server.
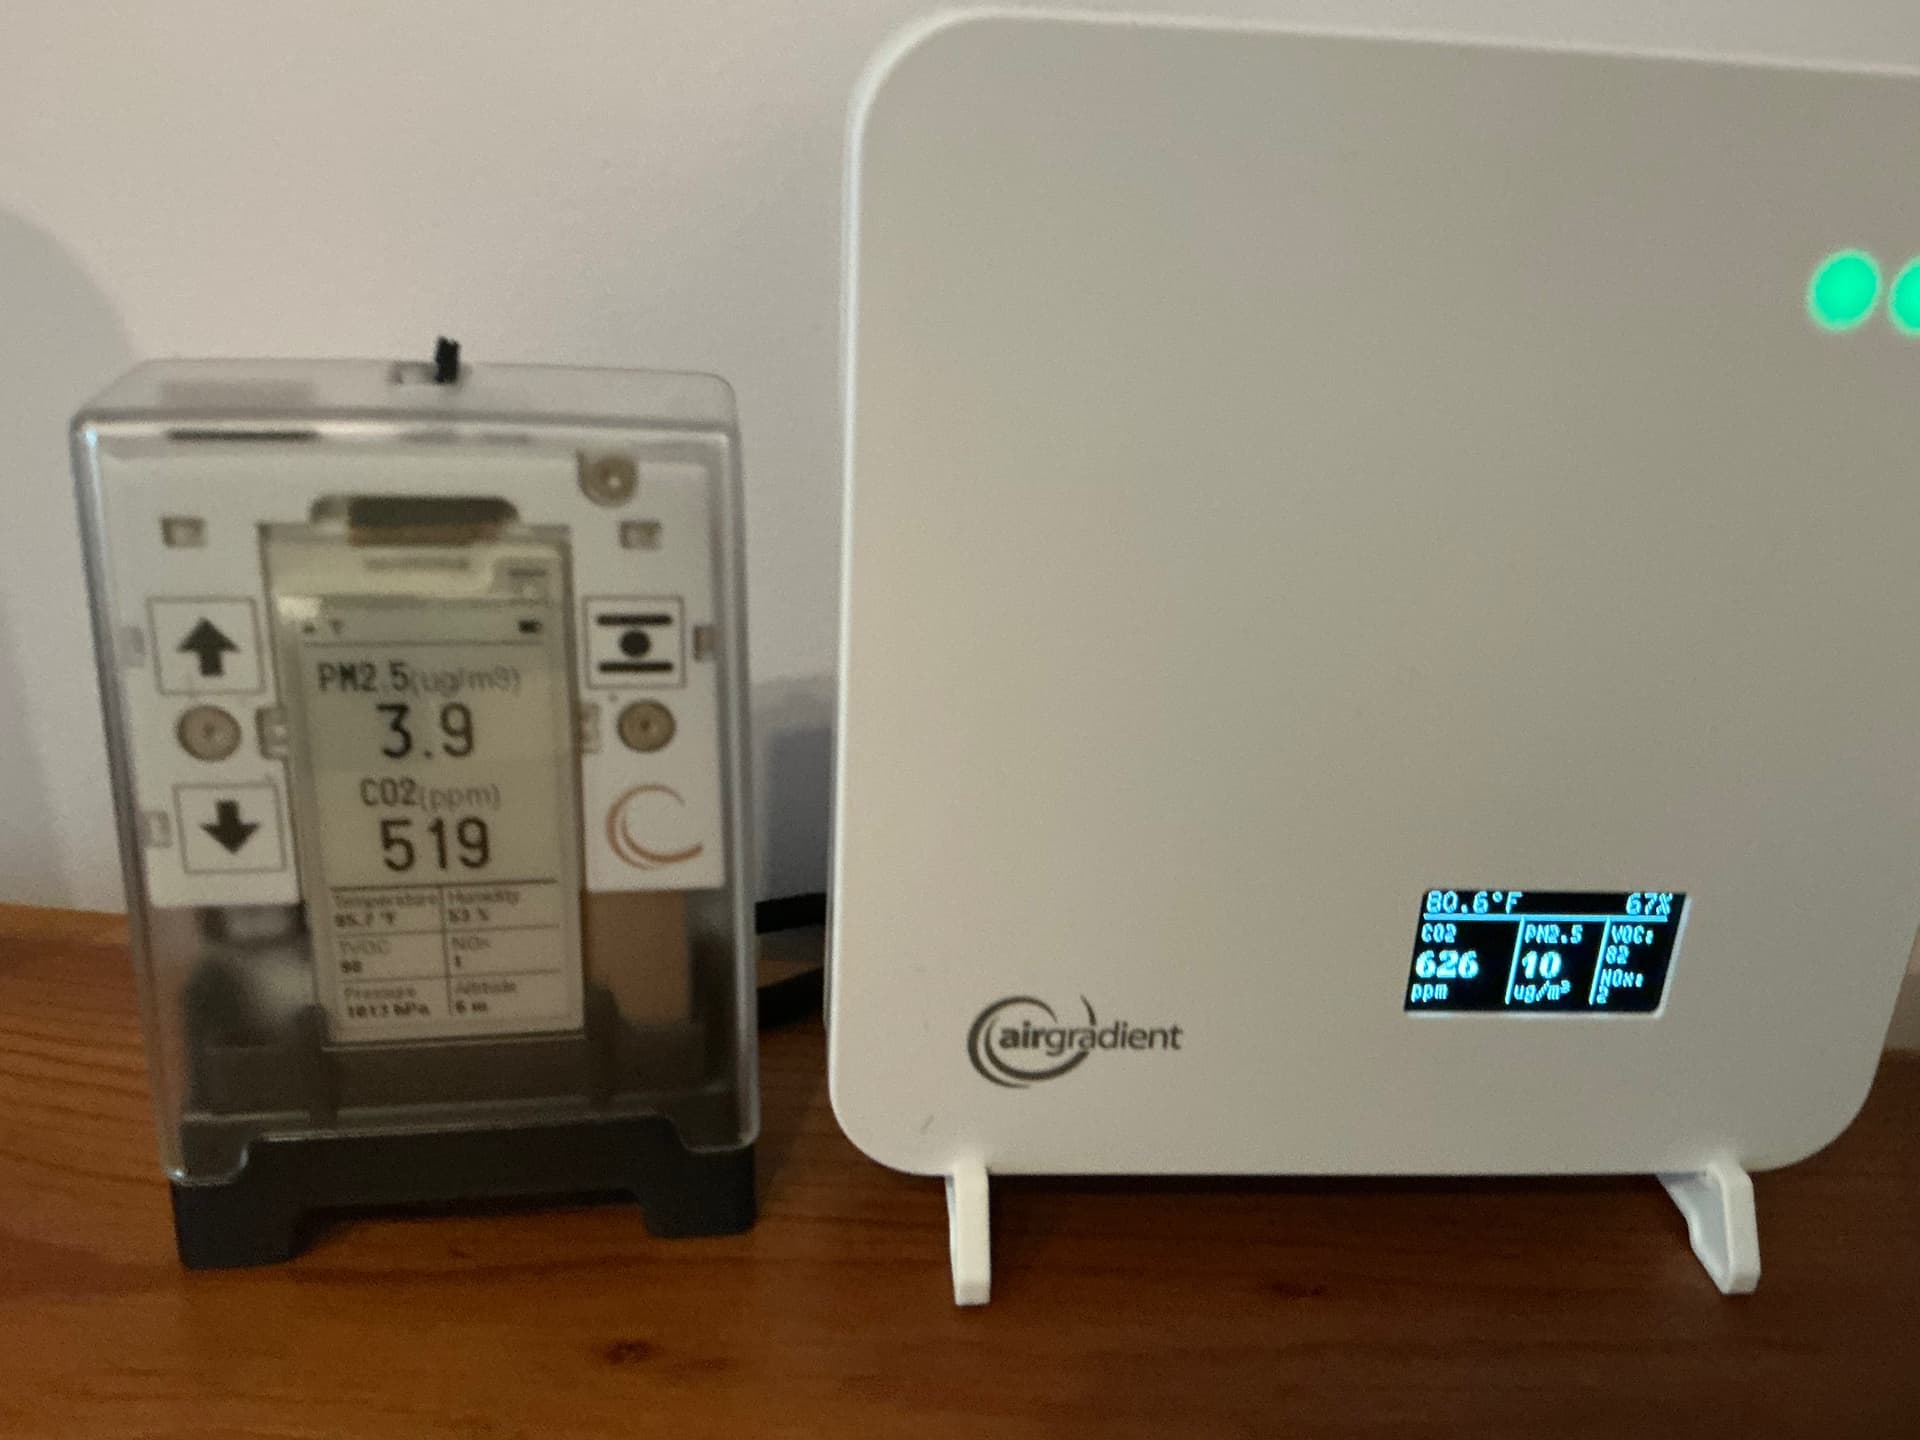
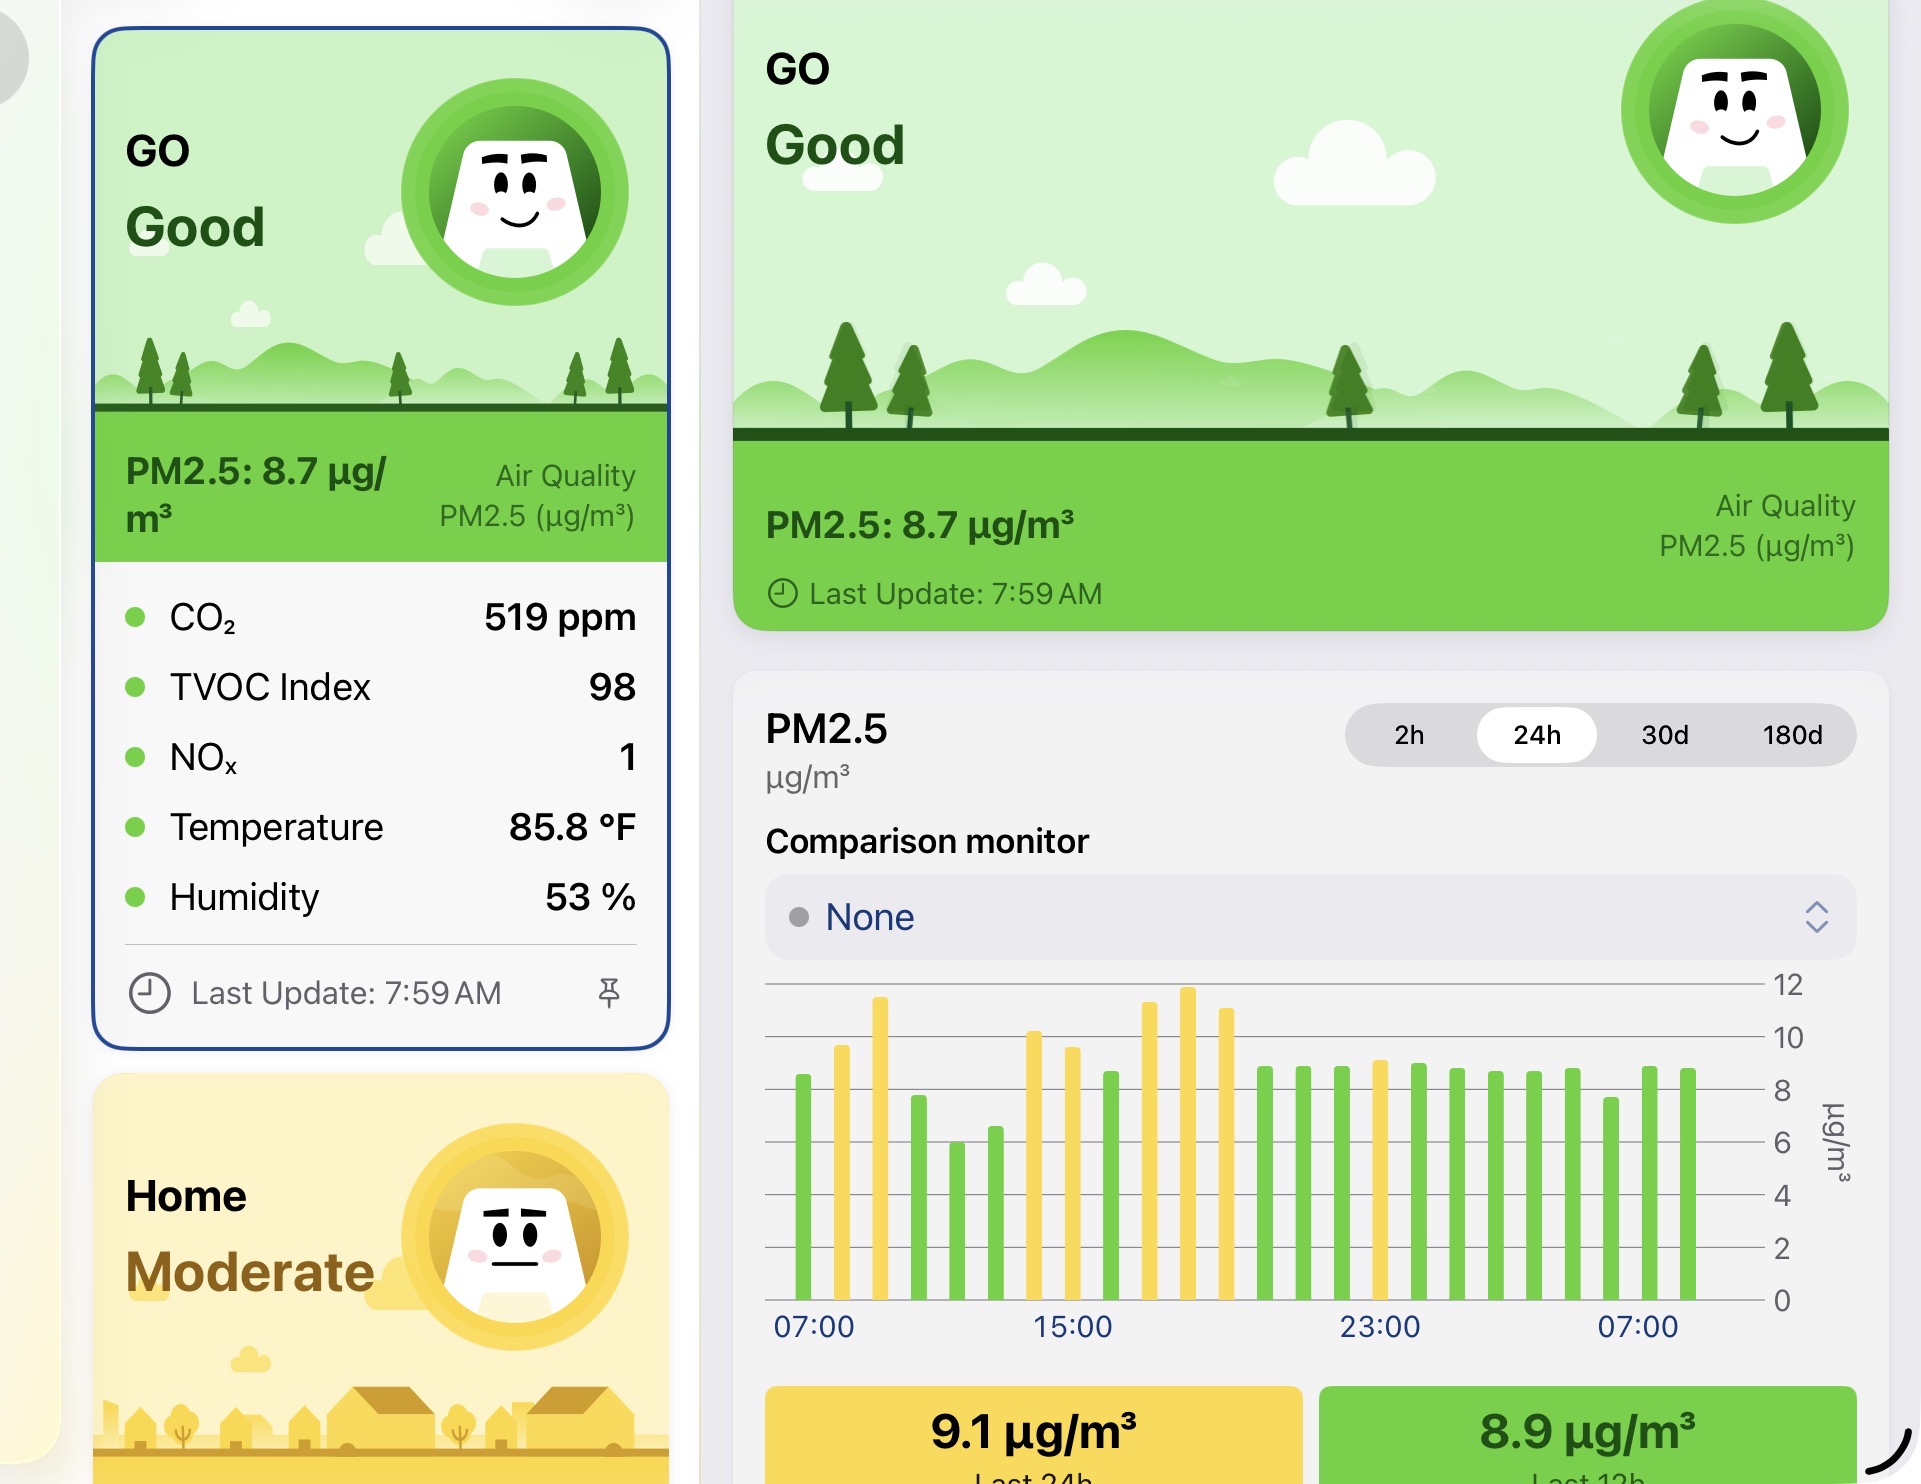
3 Likes
@chris_bernhardt, thank you for providing more information about this. We are investigating this further.