AirGradient Forum

Adding an alarm for VOC readings?

I just got my new I-9PSL set up and it’s about to finish its first 24h of monitoring. Love this kit so far!

Perhaps a naive question: in the Dashboard “Alarms & notifications” section, I see there are options for CO2, PM2.5, humidity, temperature … but not the TVOC readings. Is there a way to alert on those? Or do I need to roll my own and use the local API?

1 Like

I do this with uptime Kuma see my other linked post

The value of TVOC may be limited tho. I’ll see mine go up to no explicable reason in the middle of the day with no one around. Maybe it’s my cat but idk I don’t smell anything. Lol

Something that ranges between 50 and 500 where 100 is supposed to be normal? Not sure what to do with the information.

https://www.airgradient.com/blog/tvoc-explainer/

I really like the Airgradient units but I very much agree that an alarm for TVOC would improve the sensors a lot. For TVOC the unit currently does not work as an alarm for the person next to it, only in retrospect when someone checks the data online. I think providing an alarm for the person in the environment, for CO2, PM2.5 and TVOC should be the primary purpose of the air sensor. I’ve bought three of the air-gradient units so far, and would get more but for this aspect of the current design. Regardless the units have been helpful in solving some health related issues in our workplace, but because of this aspect it is actually really awkward/difficult to use the units to improve air quality. Given that we cannot practically/economically have someone constantly checking the data, there will always be a delay between when ‘acceptable’ levels are breached and when it’s picked up. This means, after we realise there has been a breach, we then need to go back through CCTV footage to find out what caused the issue at that exact time - which is time consuming process! Its’ like having smoke alarm that doesn’t go off but plots that the rise in temperature of your house on a graph which you can check online! The units are well made and designed but this aspect desperately needs improved

Since there isn’t the hardware for an alarm currently included, would having a setting for the LED bar to indicate TVOC levels be a move in the right direction?

You could also look into setting up HomeAssistant which can do various automations based on any of the sensor values so you could get an alert on a phone, or turn on a smart light, or various other things.

Finally, you could also play with an ESPHome firmware that I setup which includes a combo LED setup where some LEDs indicate CO2, other represent PM2, and one reflects the TVOC levels, so at a glance I can see what is going on from across the room

This sounds like it’s moving in the right direction. If it is possible to have one or two LEDs showing TVOC alarm of a kind, could they all be used to show TVOC, which would provide a visual alarm? If it is possible to do that then one work around would be to have a separate monitor for each of the three main levels - PM2, CO2 and TVOC

This is how I have my combo bar setup:

The far right blue LED is reflecting TVOC.

In the ESPHome config, it wouldn’t be difficult to setup the whole bar dedicated to TVOC, although there isn’t one today. But 3 pieces of hardware just to display different values seems excessive to me.

So you set the threshold for when the blue light comes? I like what you have done here and it is a step in the right direction. I think you are also right about having three pieces of hardware, but in practise in any given space/circumstance it’s generally one issue you are battling and trying improve, possibly two max. Yes, initially, to identify there’s an issue, it’s good to monitor everything, but you are doing that in the dashboard anyway. In one kind of space CO2 is an issue, and in another PM or TVOC. We happen to have a TVOC issue - like almost every industrial facility in the world (whether they know it or not yet), CO2 and PM are almost completely redundant in our mission to improve that. What we need is a way to show, as obviously and intuitively as is possible, the moment that TVOCs are rising sharply, to help us identify what the cause of the issue is. It wants to be so easy to understand that it doesn’t need explanation, and be as noticeable as possible, even if you don’t look at it directly. In that I think being able to switch the LED display to TVOCs purely would help. I wonder what might it take to get you add this to your firmware @MallocArray ? Keep up the good work in any case.

I built a new file to make the entire bar represent the VOC levels. Still working on finishing touches for a full release in the Github, but wanted to get something to you quick.

Green represents a value close to 100, which is baseline. As VOC gets higher, it will trend toward purple as it approaches 400. As VOC gets lower than 100, it will trend to blue as it approaches 50

Check out the directions for using the ESPHome Web Install here:
MallocArray/airgradient_esphome: ESPHome definition for an AirGradient DIY device to send data to HomeAssistant and AirGradient servers

The compiled firmware version can be downloaded here for the next 2 weeks:
ag-one-voc-led.bin

We hope to be able to provide alarming for TVOC (Ind40) soon, hopefully within 2 weeks.

Nick
AirGradient

1 Like

@nick that sounds great. Can you elaborate on what you mean by alarming?

@MallocArray Excellent work indeed. I have connected to the device via the ESPhome web interface and successfully uploaded that bin file. The readings currently appear on the device, but no longer on the airgradient dashboard. The LEDS aren’t currently lighting up. I wonder, is there an way to start sending data to the airgradient dashboard, enable the TVOC LEDs (and perhaps change the temp from deg F to deg C!) with out setting up a home assistant system? i note there is a ‘web_server:’ - I think, in my case, I would need more instruction to be able to do that. Any pointers gratefully received.

After flashing the firmware, you need to reconnect it to your home wifi. It used a Captive Portal:
Captive Portal — ESPHome

There should be a new wireless network visible that you can join to configure your personal wifi info. If you don’t see it, you may need to power cycle your device, as I’m not sure if it always stays up, or if it turns off after a certain amount of time. That should return it to reporting to the AirGradient Dashboard.

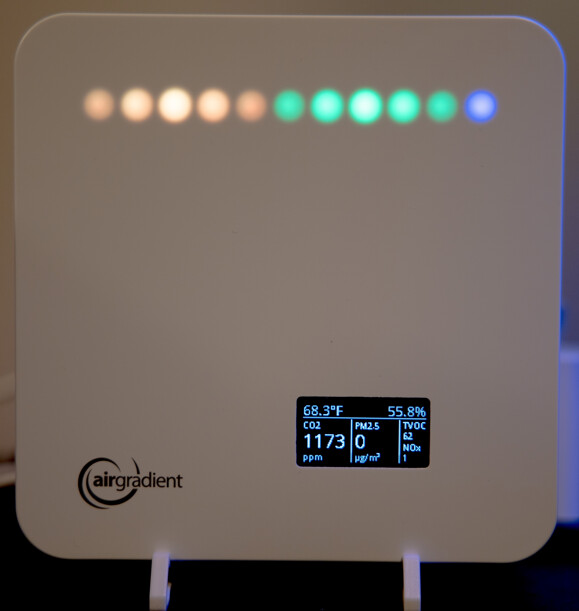
The LEDs should light up as soon as there is valid data from the TVOC sensor. It takes 1 minute before it returns good data, so if you let it sit, the lights should come on. Verify if you see a number on the display for the TVOC values and if the LEDs still aren’t on, let me know.

To change from F to C, you can press the button on the back of device with a short press. The button is behind a small hole in the case, so you’ll need something long like a small screwdriver or a toothpick to press it.

Alternatively, the web_server can be enabled so you could change this and other options from the interface, but I don’t have it enabled by default, I leave it up to the user. I could compile another firmware to enable that for you, but lets make sure you can get it connected to your network and reporting back to AirGradient Dashboard first.

Changing from F to C worked a treat. TVOC reading is showing on digital readout but, as yet, no LEDs. I did connect the unit to local wifi from the ESPHome web interface internet while it was connected to the device - i presume the Captive portal is different? it is still offline on the Airgradient dashboard in any case

Try disconnecting power for a few seconds and then power up again. Sometimes that clears up some odd things.

Not sure why it wouldn’t be reporting to the Dashboard, as long as it is on the wifi it should be. You could check the logs from the same page you used to flash it.

Yeh, have powered up and down few times. ! This is the screen that I installed the .bin file from, after doing ‘prepare for first use’ image|690x196

Then was able to connect using wifi from here also.

I have now reconnected through ESP home as it was still paired. There appears to be nothing in the log file though, and when trying configure wifi the following shows

Not sure if any of this info is helpful.

Double check to see if you have a new wifi network from the AirGradient. Maybe that error about serial improv not being detected prevented it from actually configuring the wifi

there is one called ag-one - I presume that’s it? What would next stage be? Thanks

Using a wireless devices like a laptop or a mobile phone, connect to that new network. It should take you direct to the configuration page, but if not, you can go to
http://192.168.4.1/
while you are still connected to the AirGradient’s network so you can enter the credentials for your personal wifi

Did manage to connect to its wifi network as you suggested. After attempting to connect it to the wifi local network here, it has disappeared - it doesn’t appear to be connected (unless it is and I’m unaware, but it certainly isn’t online on the airgradient dashboard) and it also doesn’t have its own network. I guess we are down a bit of a rabbit hole here as sometimes happens! Not quite sure best thing to do -

One way to check to see if a device is connected to the network is to use a network scanner. I use Angry IP Scanner, which is a well known Open Source program.

Whatever programme you use, make sure that it also displays the MAC address.

By default, Angry IP Scan shows the IP address and Host name (device name) (if the name is shown on the network). If it doesn’t show the MAC Address, click on the dashed fetchers box next to the Start button. Highlight MAC Address in the Available fetchers column, then click on the left arrow to move MAC Address into the Selected fetchers column.

I find that the AG monitors do not show a Host name. However, the device serial number is the MAC address. So look down the MAC Address column for the MAC address that matches the monitor(s) you are looking for.

If the monitor is connected, it will show as a green or blue blob next to the IP Address(I can’t remember what the colour difference is for).

If the monitor is showing up OK in the scan, then it should be connected to the network OK.

Just in case you haven’t done so:

The dashboard doesn’t automatically recognise a monitor, it has to be added:

In the main dashboard index, click on Connect a Monitor and go from there