I hope this post helps some folks out there 
For a whole host of reasons, I use Uptime Kuma to tell me when things go “wrong” for IP connected devices. This isn’t a good place to track or graph stastics of the actual readings you get like in the AirGradient Cloud, but it is an easy way to get alerted when things go wrong.
The purpose of Uptime Kuma is really to alert you when a device “goes offline” but theres a less documented feature which lets you use it to tell you when JSON readings are outside of thresholds you set.
First, lets see what criteria is available from my Airgradient ONE. In a web browser, navigate to the IP of your device like this:
http://10.69.10.92/measures/current
Next, identify what parameter you would like to monitor.
{
  "pm01": 0,
  "pm02": 0,
  "pm10": 0,
  "pm01Standard": 0,
  "pm02Standard": 0,
  "pm10Standard": 0,
  "pm003Count": 0,
  "pm005Count": 0,
  "pm01Count": 0,
  "pm02Count": 0,
  "pm50Count": 0,
  "pm10Count": 0,
  "atmp": 27.22,
  "atmpCompensated": 27.22,
  "rhum": 30.38,
  "rhumCompensated": 30.38,
  "pm02Compensated": 0,
  "rco2": 708,
  "tvocIndex": 73,
  "tvocRaw": 30920.33,
  "noxIndex": 1,
  "noxRaw": 16410.17,
  "boot": 228,
  "bootCount": 228,
  "wifi": -52,
  "ledMode": "co2",
  "serialno": "744dbdcf7b30",
  "firmware": "3.1.21",
  "model": "I-9PSL"
}
I’ll choose rc02 as an example.
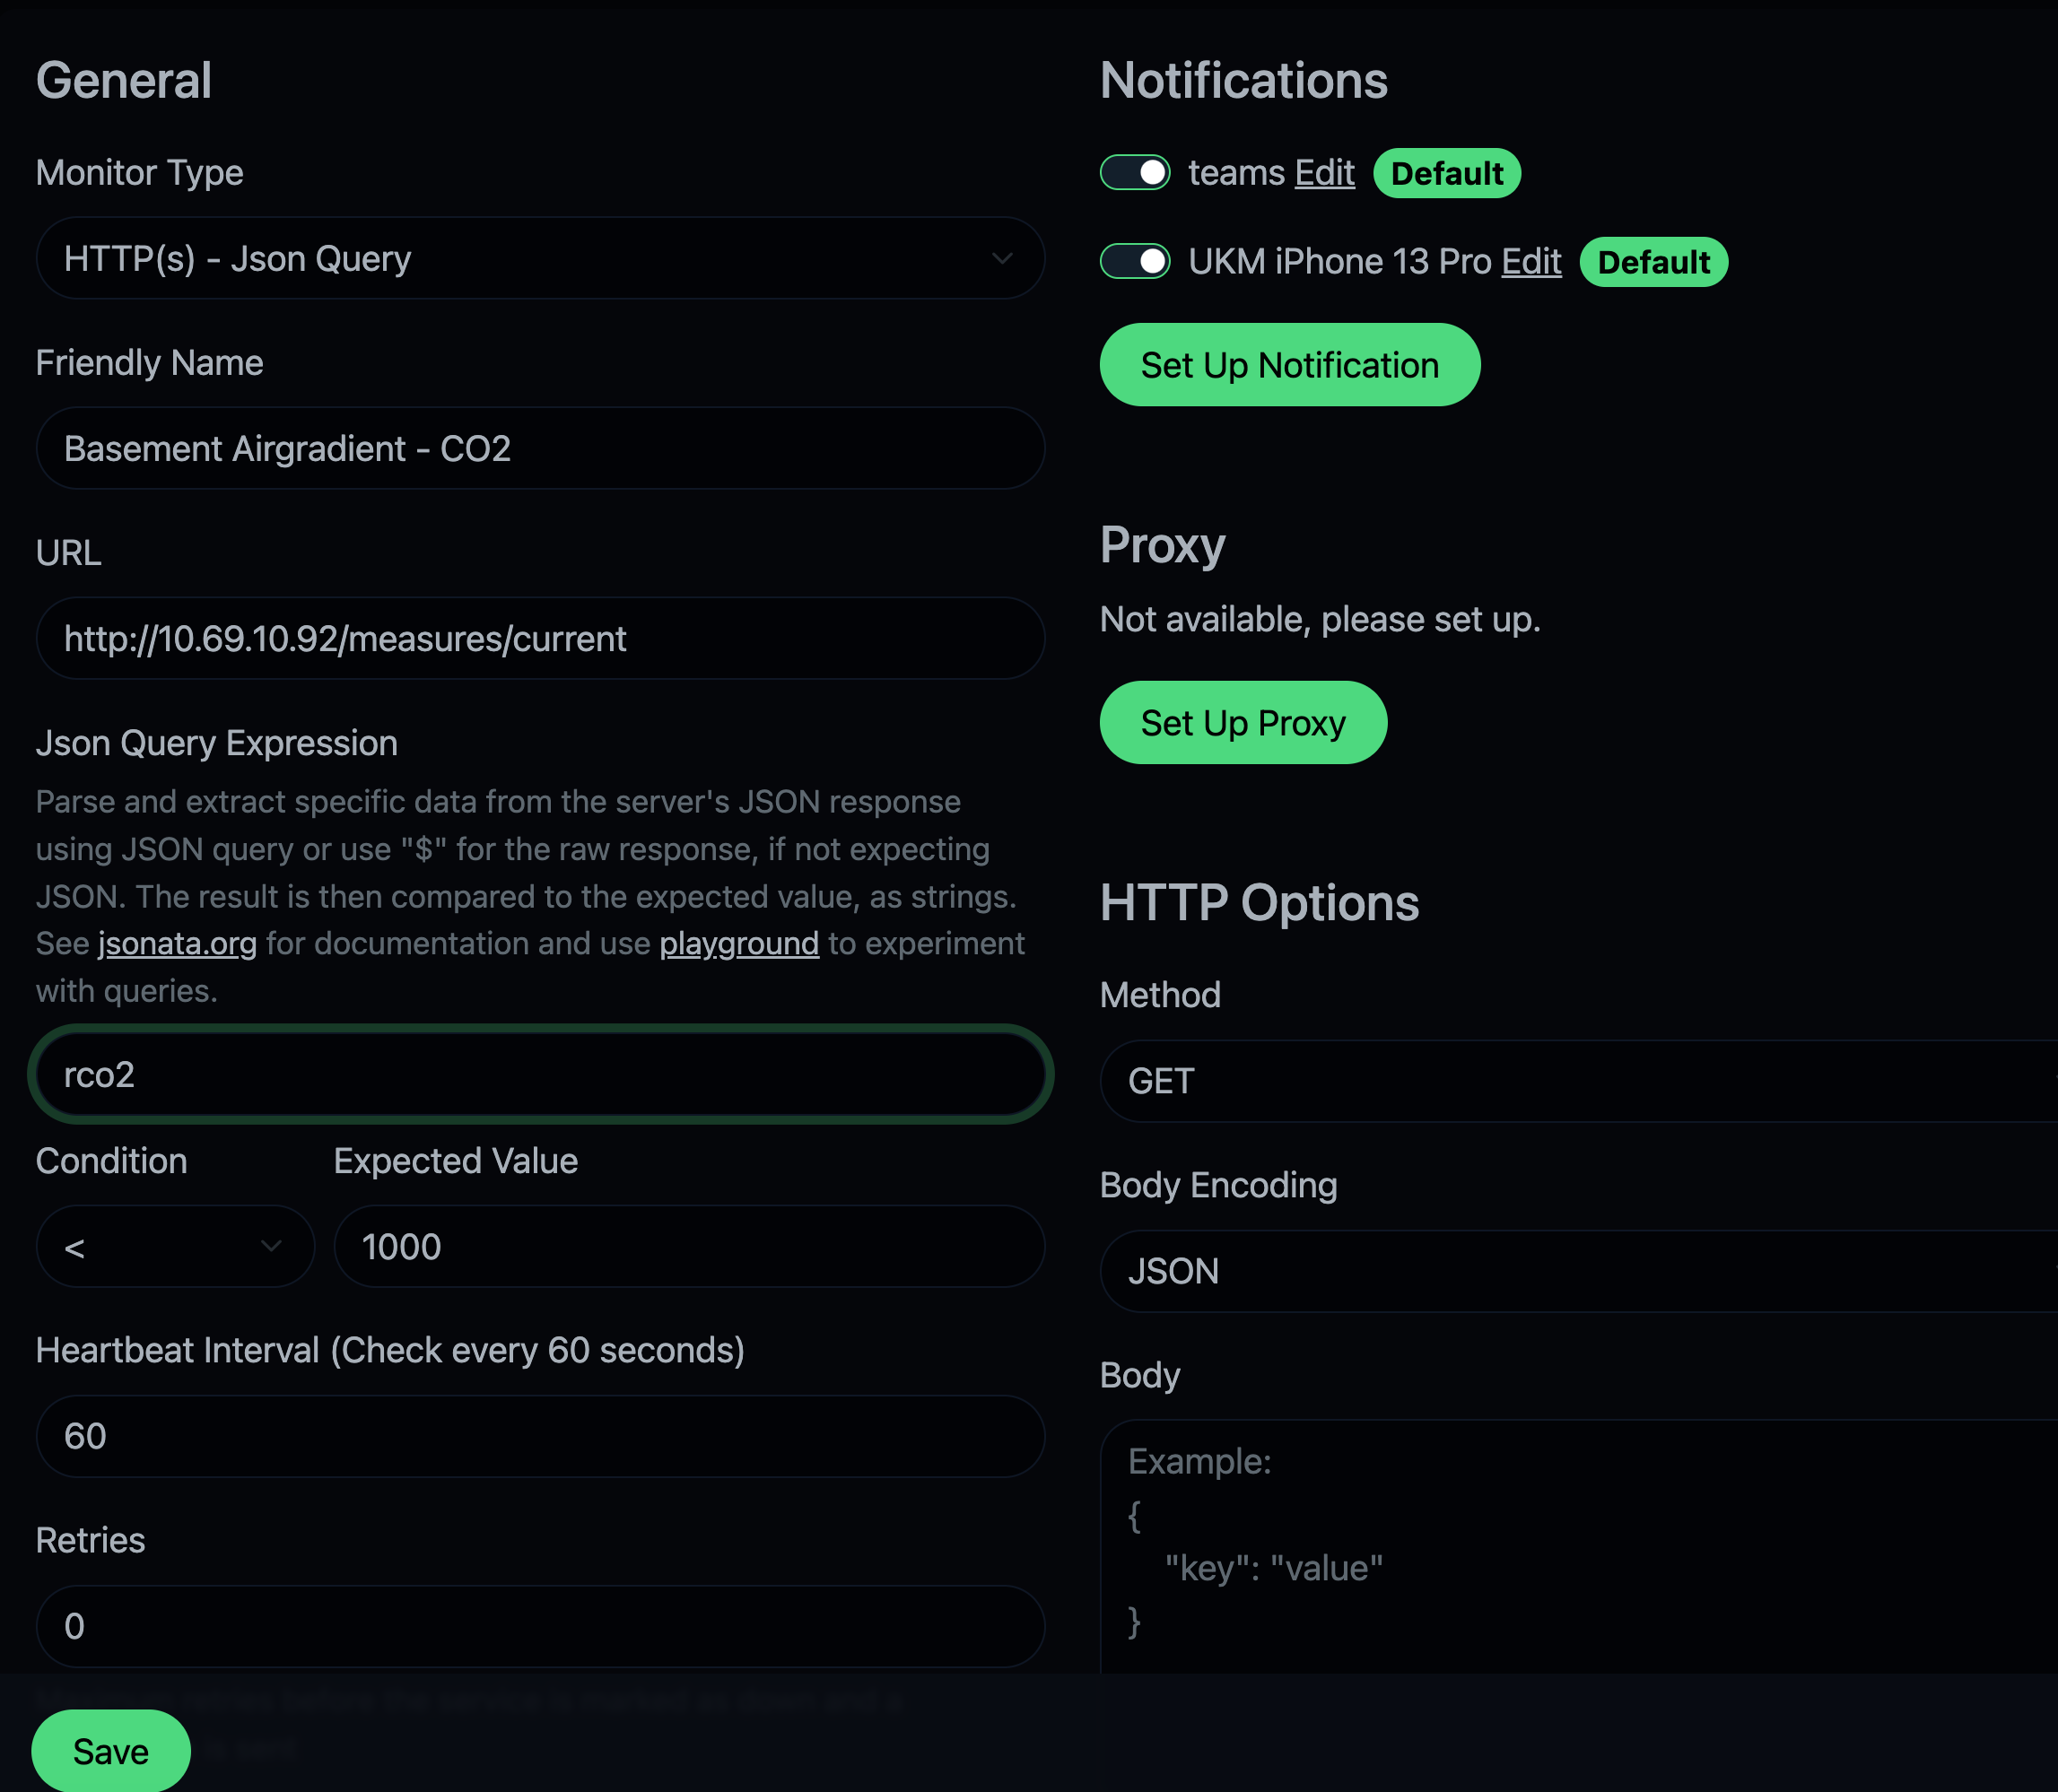
I’ll start in Uptime Kuma by choosing the “HTTP(s) - JSON Query” Monitor type and give it a friendly name like “Basement Airgradient - CO2”. Then I will provide it the URL we found earlier like “http://10.69.10.92/measures/current”.
In the JSON Query Expression, just choose the varible you would like to monitor, in my case “rc02”. Then set the condition you would like to receive an alert based on. In my case, if CO2 goes over 1000, I want to generate an alert.
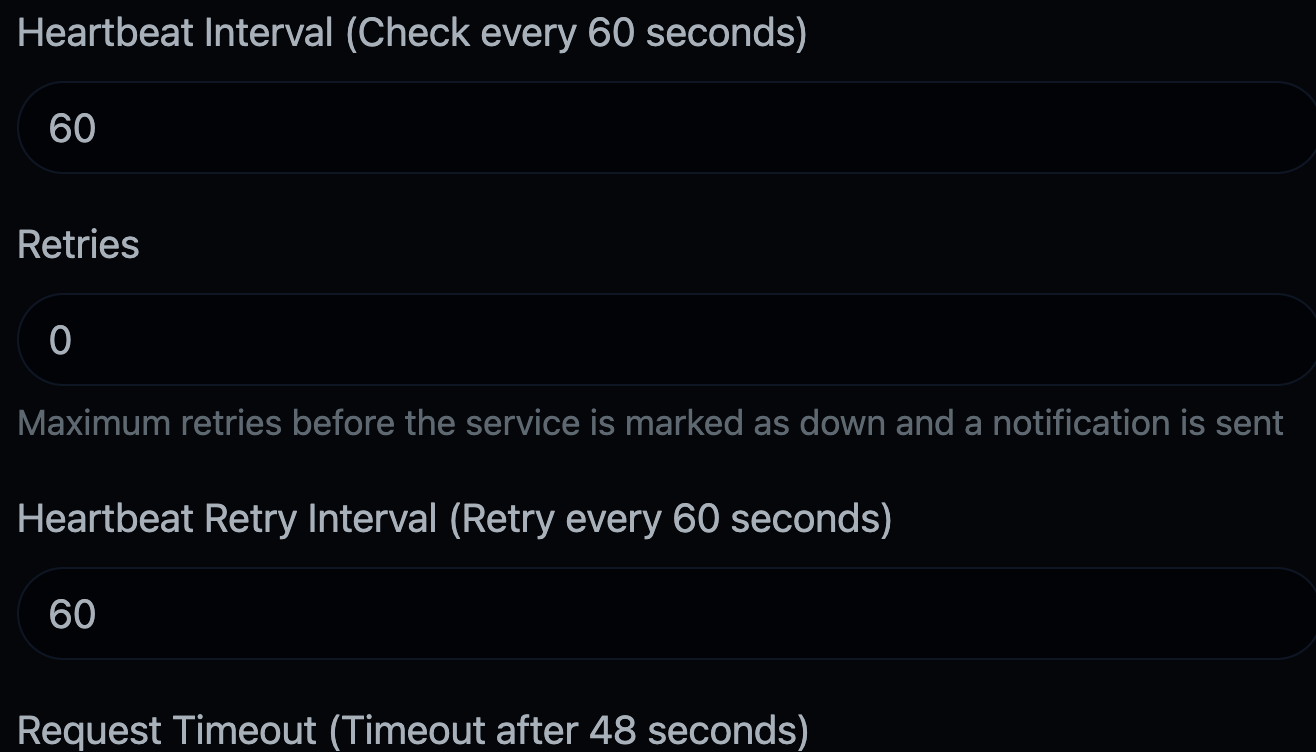
By default, the rest of the options should just work. You can change the interval to poll your device more often, but 60s is probably fine for most people.
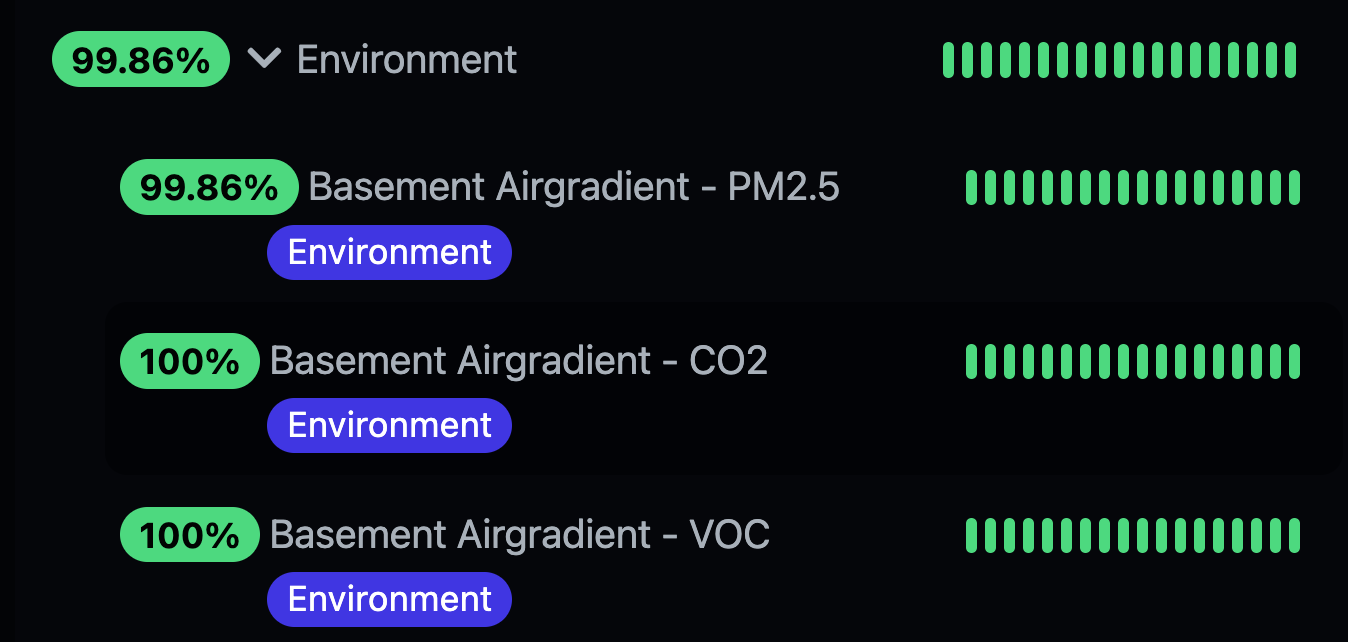
Repeat the same for each parameter you would like to monitor. UptimeKuma will report how often in a 24 hour period your air was within the defined thresholds.
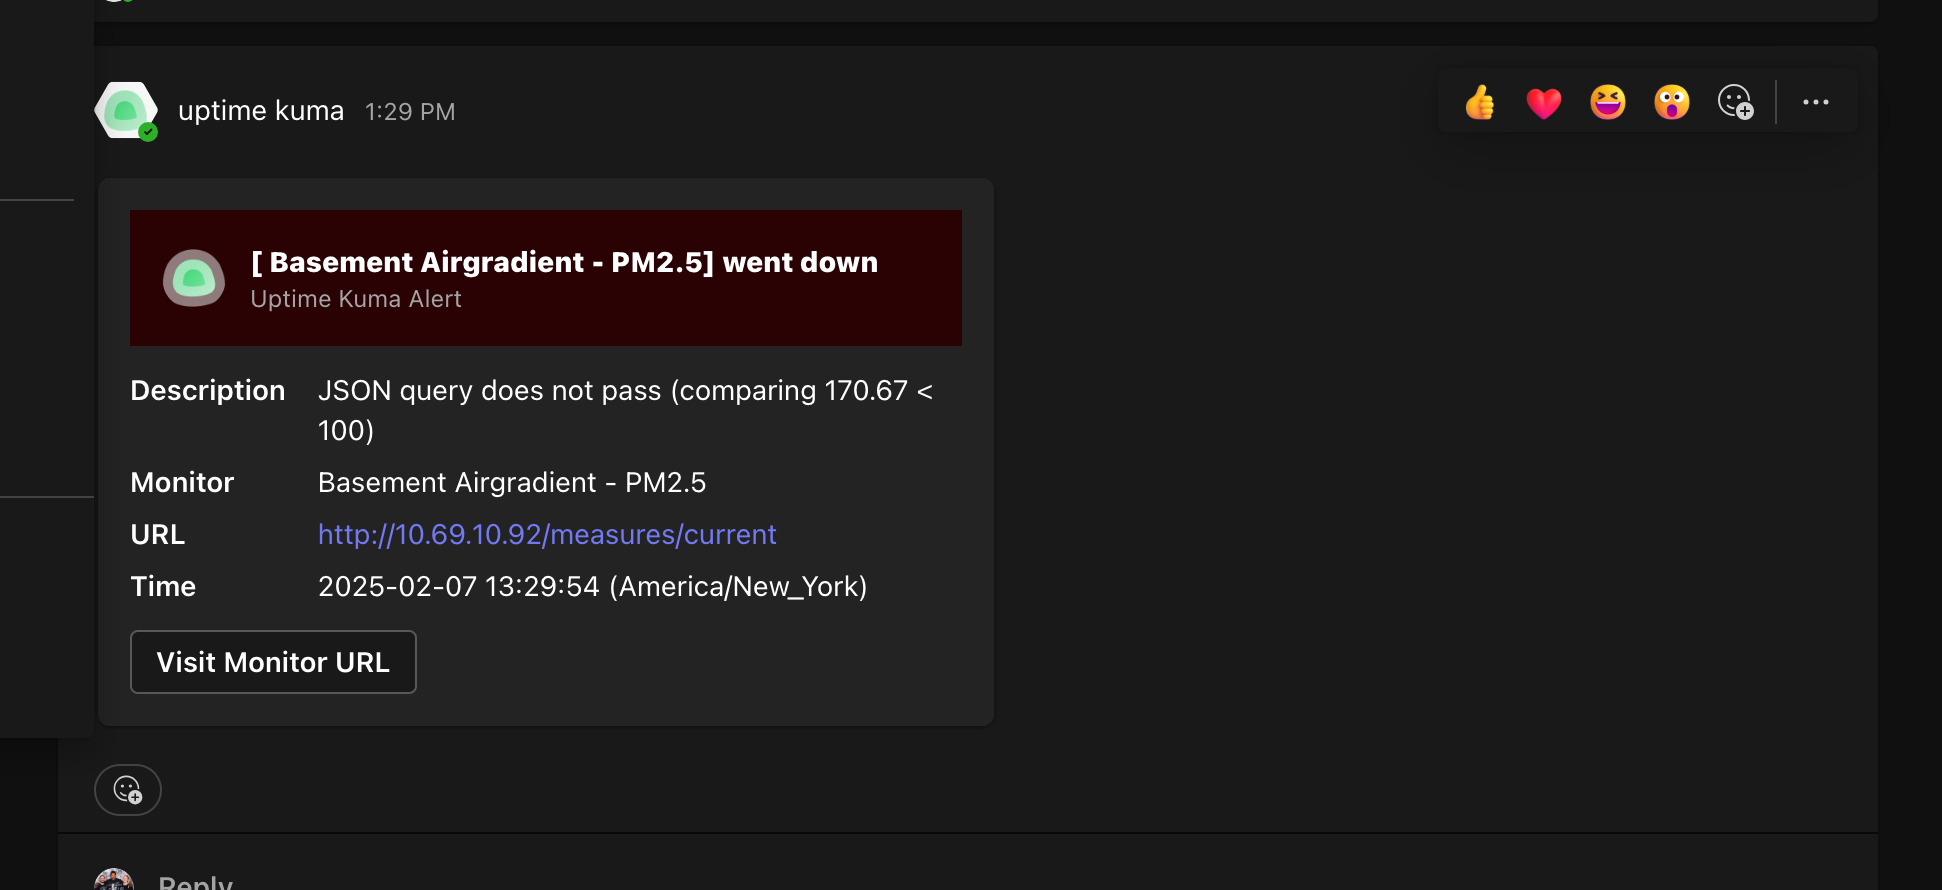
With that setup, I now get an alert on my cell phone and in Microsoft Teams any time my air quality becomes worse than I would like. “Went down” is misleading here, what this alert tells me in the “Description” field is more important. In this case, PM2.5 went over 100.
Then, about a minute later, it came back down under the threshold
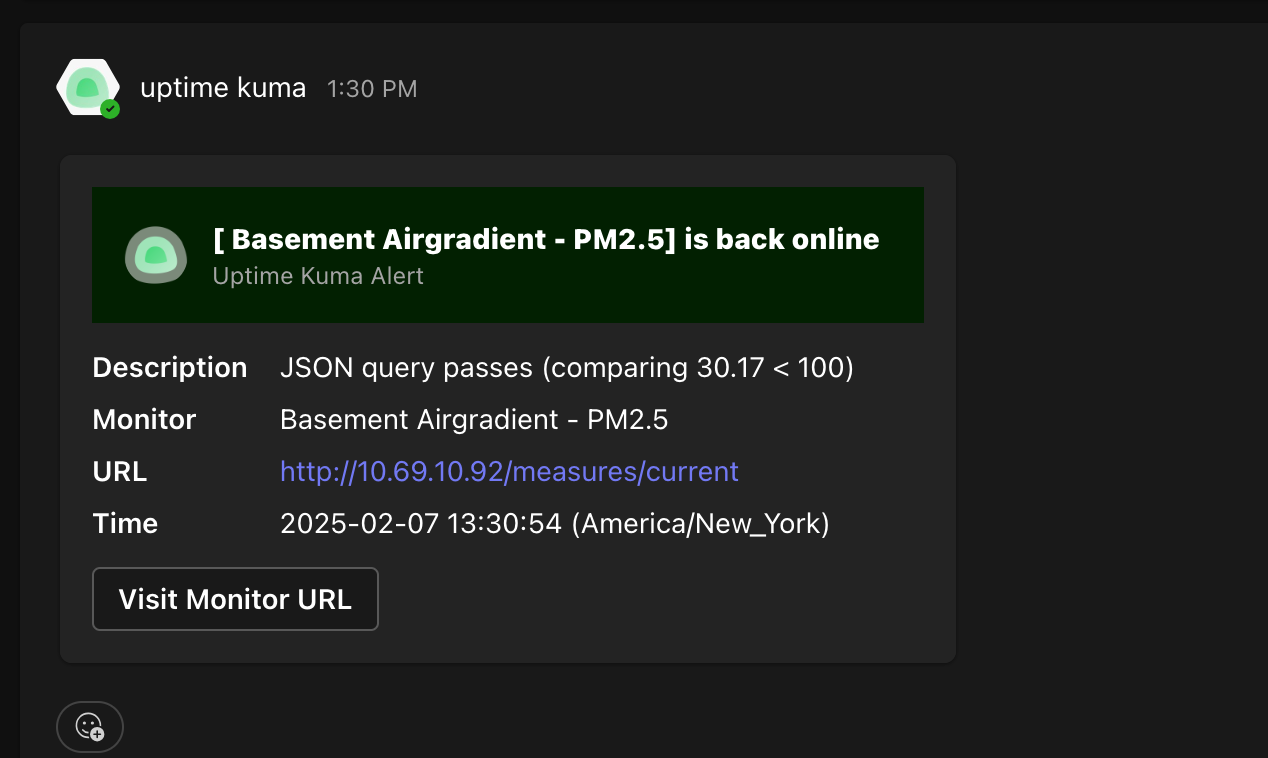
In this case, I might not want to receive this alert, because it recovered so quickly. I can change the “Retrys” value to a higher number, like 5, so that an alert only gets generated if the value stays over 100 for 5 straight minutes.