I’m finally seeing my sensor data showing up on the OpenAQ map, but the readings are much lower than what I’m seeing in my AirGradient dashboard.
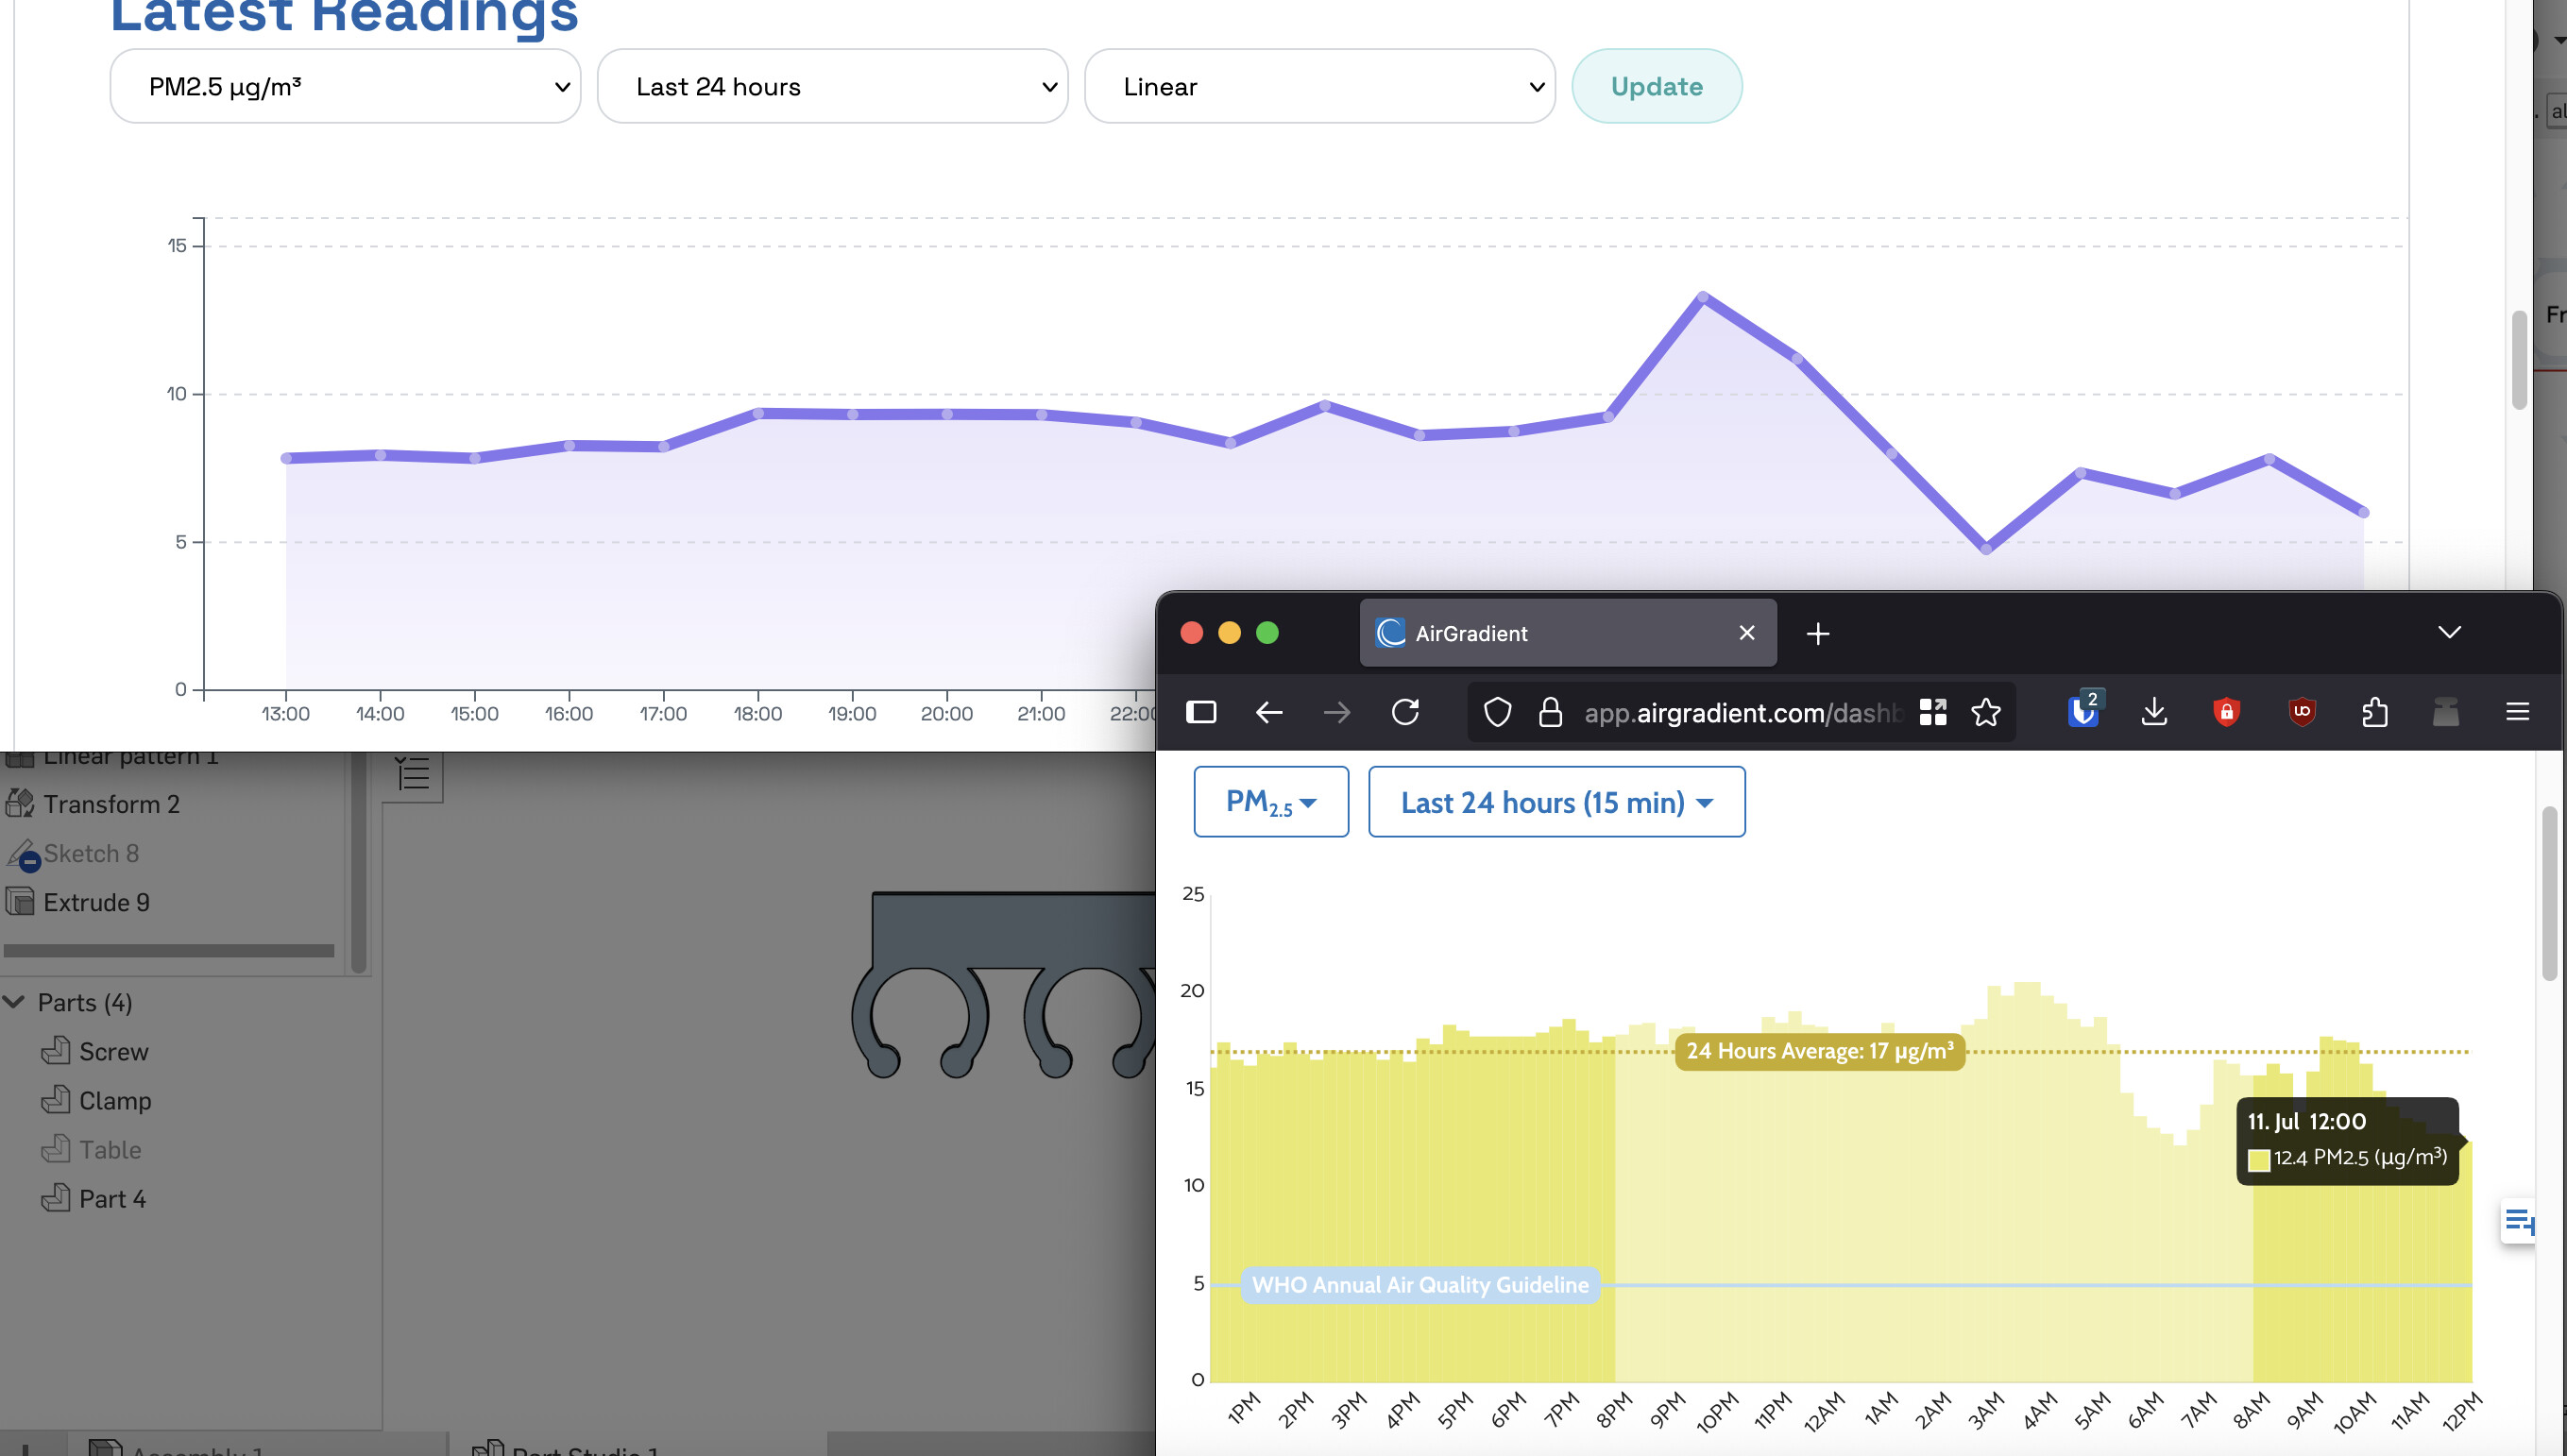
The overall shape is correct, but the numbers are way off. For example, the latest reading in the AirGradient dashboard is 12.4 but it’s 6ug in OpenAQ.
I don’t know if it’s related, but when I look at averages in the API response for 60 minute buckets for example (i.e. api.airgradient.com/public/api/v1/locations/[MY_LOCATION_ID_HERE]/measures/buckets/60), I’m seeing what appear to be much lower numbers as well, but I don’t know if pm02 is supposed to be the actual average pm2.5 or something different.:
{
“date”: “2025-07-11T17:00:00.000Z”,
“rco2”: 422.8171691894531,
“atmp”: 26.70599937438965,
“rhum”: 52.153831481933594,
“pm02”: 3.858833392461141,
“heatIndex”: 27.1233336130778,
“datapoints”: 14
},
{
“date”: “2025-07-11T16:00:00.000Z”,
“rco2”: 425.45970662434894,
“atmp”: 25.899791558583576,
“rhum”: 53.70170879364014,
“pm02”: 4.635791659355164,
“heatIndex”: 25.991666475931805,
“datapoints”: 58
},
The pm02 values aren’t anywhere close to what I’m seeing in the AirGradient dashboard.
Any idea why these numbers would be so different?