Two DIY Pro Kit sensors not showing up in the dashboard: no traffic on network; does respond to ping!

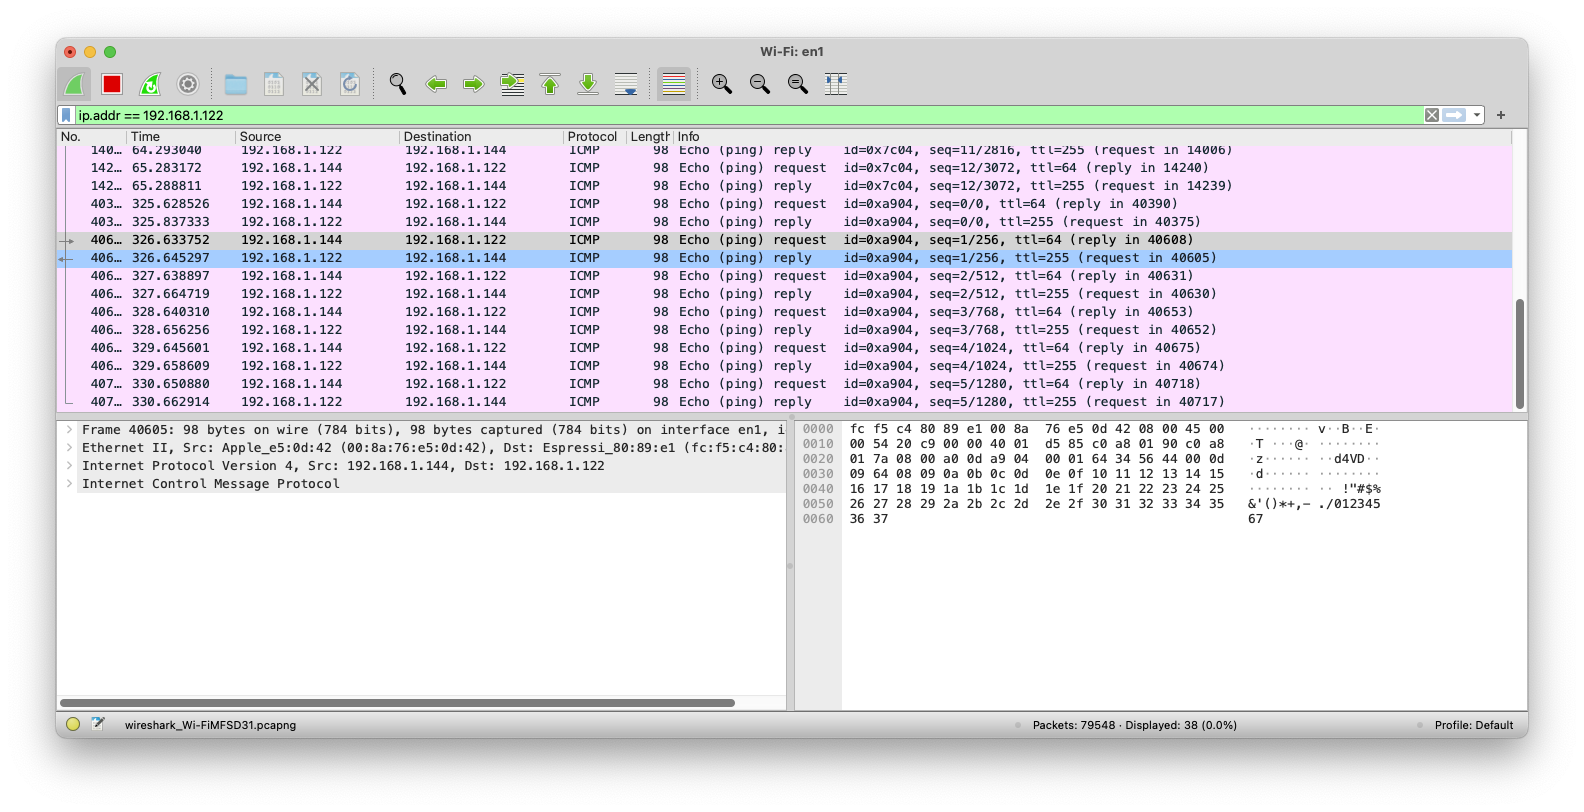
I need some help here, please. I have two kits that are connected to my local network and respond to ping. There is no traffic outbound from the device I am testing right now, I have rebooted a couple of times, but nothing on startup. I am running a Wireshark capture and see no traffic except the Pings

I am not sure where to go from here? Is there some sort of factory reset? Should I flash some other software than want came from the factory?

I also have some frustration with the hotspot system. I am thinking about some different code to make this “better”. Something that would put debug info on the little screen, but I digress.

How do I get un-stuck here folks?

I was lucky enough to be able to capture on my router, and able to see the packets towards airgradient cloud server (165.22.51.108).
(only on the router itself you will see the packets of interest)

I assume you are still trying to get the dashboard working?
If you reboot (I made a video for myself for easy playback) you will see:

60s to connect to Wifi Hotspot AG-<yourSerial>

You should only use the <yourSerial> part when setting up the dashboard connection.
(it will not give an error if you type something wrong)

Thanks for the note. The IP address of the cloud server is helpful. I see no traffic to that address until I launch the web browser to visit the dashboard.

I rebooted the my DIY unit while monitoring the network and there is no traffic out of it. I know I am pinging the right device because I see the Mac address is the same as the “id”

I even tried using a different router for a couple of days, nothing. Still stuck…

what was the traffic type from the unit oubound? HTTP or something else? I guess I could look at the source code…

In the capture (~1 minute, 74 packages) I have most are just decoded as TCP.
I do see a HTTP packet with a POST with measured data (in JSON format).

I have no traffic from either device.

is there a factory reset or something to try again?

Please send me a message via our support form and then we can arrange a zoom call and I can help you setting it up.

https://www.airgradient.com/support/

-Achim

I had a similar problem and it seems that a few people struggle with the same step. I think that the docs could be a bit clearer on two issues:

i) exactly what is the serial number? I eventually found the answer to this here: Finding the DIY board's serial number (AirGradient dashboard integration) - #7 by Bobfa although there are a few posts asking for this info. It doesn’t work or give an error if you format this serial number in any other way.

ii) what is happening when the system is “sending” data? I understand it goes to the airgradient dashboard, but is it also accessible as a http/json endpoint at some IP address, so that we can use other dashboard software, or write our own?

So in my case there were three problems.

  1. There was a configuration issue on Airgradient server side.
  2. One of my sensors was not on wifi due to an autocorrect issue on my iPhone that made the first letter of the WiFi password a capital.
  3. Somehow when I setup the second sensor I did not select AirGraident as the device.

Thanks Achim for the server side help.

I am thinking about some software improvements that might help. For now things are working fine. And my indoor air quality is very good!!

-Bob

I already pushed an arduino code update that will explictly say “serial # xxxx” when you start the monitor. We are also currently working on improving the onboarding on the website and also I am planing to add a video you soon.
Thank you for all your feedback.

It is open source so very easy to change the server endpoint and you can basically implement anything you want.
The code we provide only does http POST but does not provide a local json endpoint on the monitor itself.