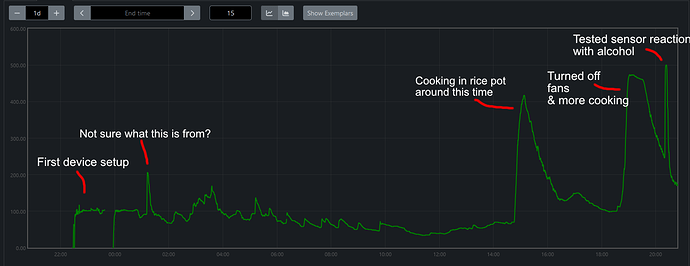
I just got my AirGradient Pro kit with the SGP41 sensor. I flashed it with code from the github repo & made some small changes allowing readings to be fetched via http. I’m pretty happy with it so far & it’s been a fun project. I noticed that the tvoc readings seem quite high though with a lot of sharp spikes, some spikes going up to 400+.
I looked up what normal tvoc index levels where & saw 100 was teetering near the slightly high side, so I decided to turn on my units fans & unblock airflow from my mechanical closet door (I have high air leakage that costs me a lot in energy bills, so I tend to put a towel under the crack of the door for better insulation). Sure enough the tvoc levels slowly came down.
Later, I decided to turn off the fans and plug back up the door to conserve some energy. I left home and came back and checked on the graph prometheus had made. I noticed there where some pretty high spikes and I realized around the 2 big spikes in my graph I was cooking. The spikes seemed pretty high so I decided to put the sensor to the test to see if it was really reacting correctly. I put a cotton ball soaked in 98% isopropyl near the device & sure enough it really quickly spiked up to a reading of 500.
Here’s the graph I’m referring to:
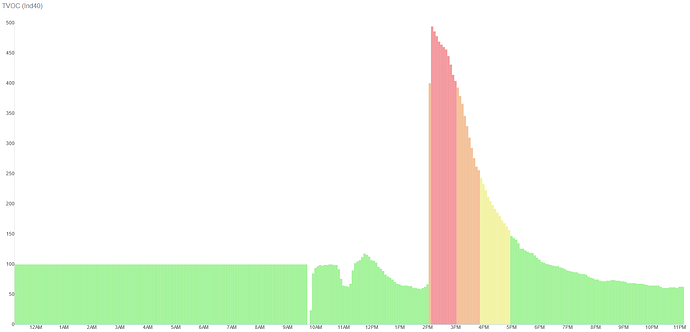
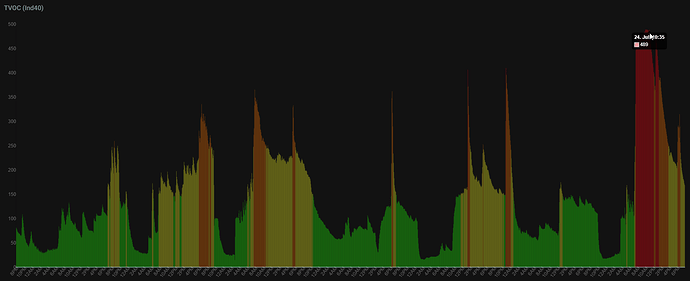
The huge spikes make me a little concerned about the air in my tiny 1 bedroom and skeptical of the device’s accuracy. Does this graph look normal to you guys? Are all those tiny saw blade-like spikes normal? I’d like to get a tvoc sensor to test if it too shows similar readings, but I’m on a tight budget & I’m not sure what devices to trust. Any recommendations for that? I’d highly appreciate any help or opinions on the normality of this graph.


