>>> Join Us in the Fight Against Air Pollution

AirGradient Forum

Thoughts on outdoor temperature and RH correction

Hi all, I started to analyze my data from the outdoor unit and apply the correction algorithms to check against a reference device in my city (not co-located though) to see how these perform. I do not know if my PM sensor would be of a batch for which AirGradient is aware the correction wouldn’t work (and I do not know how that would look like either). But I’d like to share some initial thoughts / ideas here:

  1. If the background for the correction is the electronics heating up the air, could we expect the effect to happen only on the temperature and not on the absolute humidity? In other words, if we assume the dew point to be correct, one could potentially derive the correct relative humidity based on the dew point after correcting the temperature (rather than having two separate correction algorithms for each of them). Have you tried to investigate this already?

  2. Even though I have seen the plots showing R2 > 0.99 (link), I’m still not certain whether a linear regression should work as expected to correct the measured temperature. I’d rather think that this assumes the outside temperature to change at a somewhat steady pace, but is this the case? I think one may experience smoother or steeper changes in the outdoor temperature in different locations, which might then impact how the heated air inside the enclosure responds to it, does it make sense?

Below I share some further details to support the discussion on each of these points:

(1)

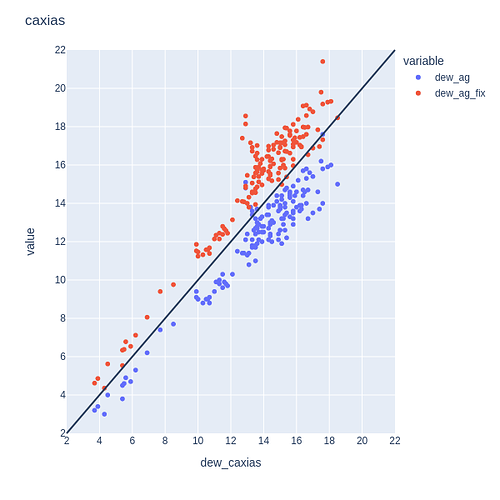
In my case, as I do not have co-located outdoor monitor and reference (they are ~30 km apart from each other), I cannot fully verify this idea, and I rather observe an offset between the actual dew point and the one estimated based on the AG measures (temperature and RH):

The x-axis is the reference device’s dew point, and the y-axis is from the AG monitor. Blue points are raw values, and red points are those after applying correction for both temperature and RH. We see the pattern doesn’t change that much in respect to the diagonal line (black line).

Here are some stats comparing these values:
raw AG → RMSE = 1.7 ; slope = 1.02 ; intercept = 1.2 ; R2 = 0.91
corrected AG → RMSE = 1.8 ; slope = 0.89 ; intercept = 0.2 ; R2 = 0.92

So I still found quite interesting to observe that the slope for the raw AG measures in respect to the reference is close to 1, and also that the RMSE of the raw dew point is even lower than the one after correction.

(2)

Here’s a hypothetical example to illustrate the idea:

Day X: outside temperature starts at 30°C and then drops to 10°C in four hours
Day Y: outside temperature starts at 15°C and then drops to 10°C in four hours

Why would one expect that the sensor temperature readings in both days X and Y would be the same in the end (when outside temperature 10°C)? I think there will be a considerable difference between those readings due to the initial temperature the monitor was exposed to. If that’s the case, then the linear regression would yield different values - and likely on day X, it would present a greater deviation.

In other words, I think the corrected temperature should not only depend on the instant temperature as measured by the sensor, but also on some estimation of the outside air temperature variation (if at all possible - but maybe observing the ratio of the temperature change in the sensor itself could help).

Below is an example I have observed with the data I collected: we see two consecutive days and how the actual temperature dropped differently at night, even though it started more or less at the same level:

One may observe that, in the second drop (Sept 12th), the green line (actual outside temperature) has a steeper decrease, and both AG estimations (blue = raw ; red = corrected) are no longer able to keep the same pace (as opposed to what happened in the first drop on Sept 11th).

Again, I’m not sure if this is all true, as my monitor is quite far from the reference device, but at least on my mind the reasoning seems to make sense.

Looking forward to hearing other perspectives around these points, and hopefully learn more about it. I’ll keep collecting more data to have more robust analysis. (BTW, I was also wondering if we could also have access to the data used in the past to create the correction algorithms, that could be very insightful).
1 Like

Thank you for sharing these interesting ideas and the plots!

Here some thoughts regarding your points:

  1. I think your are right: the dew point contains information of absolute humidity, which can be converted to relative humidity if temperature is known. To my knowledge, the integrated humidity sensors in AirGradient’s monitors measure relative humidity and not dew point. I think the dew point data is generally not available unless it is calculated based on measured temperature and relative humidity. In other words, using dew point to derive relative humidity would be circular reasoning unless the dew point is physically measured. Please let me know if you have information that states otherwise.

  2. Please correct me if I did not understand correctly: I understand you suggest to consider not only the current timepoint, but also the historical timepoints to evaluate the temperature bias of a given timepoint. I am a chemist who spent quite some time measuring things of all kinds. In my opinion, measuring temperature of a non-equilibrated system is one of the most challenging things I had to measure. This is counterintuitive given that temperature seems simple, but is it that simple? If the system is equilibrated, meaning that all atoms in the system have the same temperature, then yes. But if the system is not equilibrated? See below for my elaborations.

Measuring temperature is more complicated than one would think
For example, let’s think of a classical mercury thermometer which measures temperature of ambient outdoor air. In this example, temperature changes constantly given the time-dependant influx of heat from the sun as well as time-dependent changes from wind. Note that the thermometer has drastically higher specific heat capacity than air, meaning that it requires more energy to heat 1 g of the thermometer than 1 g of air. Similarly, the heat conductivity of the thermometer is much higher than air. This means that the thermometer and the ambient air will likely never truly have the same temperature throughout a day, especially when the thermometer is placed outside. Given the temperature difference, there will be a temperature gradient between the thermometer and its surrounding: if we look at the closest layer of air molecules covering the thermometer, then we will find that these gas molecules have a different temperature than the actual ‘ambient air’ due to the heat transfer between air and thermometer. We need to understand that one cannot directly measure the temperature of ambient air. Instead, we measure the temperature of the thermometer itself and assume it is the same as ambient air. This assumption is for sure inaccurate, but often accurate enough for most applications.

One example from the lab:
I currently study the PM emissions of brake wear from cars in a chamber where I spin a 500 kg flywheel with up to 1000 rpm and brake it using brake caliper, disc and pads. I find high amounts of particles smaller than 0.1 µm that seem to have drastically different chemical compositions compared to the 2 µm brake wear particles. I believe the smaller particles form because of heat-related evaporation and condensation of something inside the brake pad, implying that the temperature at the interface between brake disc and pad is of highest interest for me. However, it is physically impossible to measure this temperature. It can only be approximated using for example a thermocouple which is located in the brake pad, which gives me temperature readings of around 140 °C for harsh braking. It is important to understand that this temperature refers to the temperature of the thermocouple inside the brake pad and not to the actual temperature of the friction surface. I believe the friction surface easily reaches several hundreds if not thousands of °C on an atomic level, which is the level required to prove or disprove the hypothesised mechanism of nanoparticle generation from brake wear.

What does this mean with respect to temperature corrections?
We did the following: we co-located various AirGradient monitors with certified reference instruments and we compared the temperature readings of both data sets. We then assumed that the reference instruments accurately measure the temperature of ambient air. Additionally, we assumed that the dynamics of the heat transfer between our sensor and ambient air is comparable to the dynamics between the reference and ambient air (I hope this sentence makes sense). The latter assumption seems somehow accurate given the high temperature correlation between our monitors and the references. Our correction algorithm is based on a point-by-point basis, which does not take into account the history of every point. So far, it seems that the current correction does quite a decent job, but we are interested to improve it constantly. I like your idea to improve the algorithm and I currently try to get my head around how to implement that: does anyone know how to do correlation analysis of data points including historical points? I guess we would need to classify the data in different groups: mildly increasing temperature, strongly increasing temperature etc.

What temperature accuracy is needed?
I believe we as a community should reflect upon ourselves and ask the question: how accurate does a temperature reading for ambient air need to be? Note that the sensation of temperature also depends on humidity. Moreover, different people perceive temperature differently. For example, my brother is very consistent: the same ambient air temperature always causes the same perception of temperature for him. I am the opposite in this sense: my third-party thermometer indoor currently reads 22 °C and 61 %, but I have cold hands although wearing a jumper and slippers. The outdoor temperature here in the UK was much higher a few weeks ago and I felt warm indoor when wearing no jumper and no slippers. Note that the same thermometer reported the same temperature at the same relative humidity at the same time of the day. I have heard of other people reporting the same observation, so this seems to be a widespread phenomenon, which (to my knowledge) is not scientifically understood.

1 Like