Here is a showcase of my basic offline/local setup (without WiFi).
Note that it is nevertheless fully compatible with working online at the same time.
Rationales
- my WiFi access point is rarely on, so I switched my Air Gradient monitor to offline mode.
- it records data locally, even if access to the Internet is unavailable.
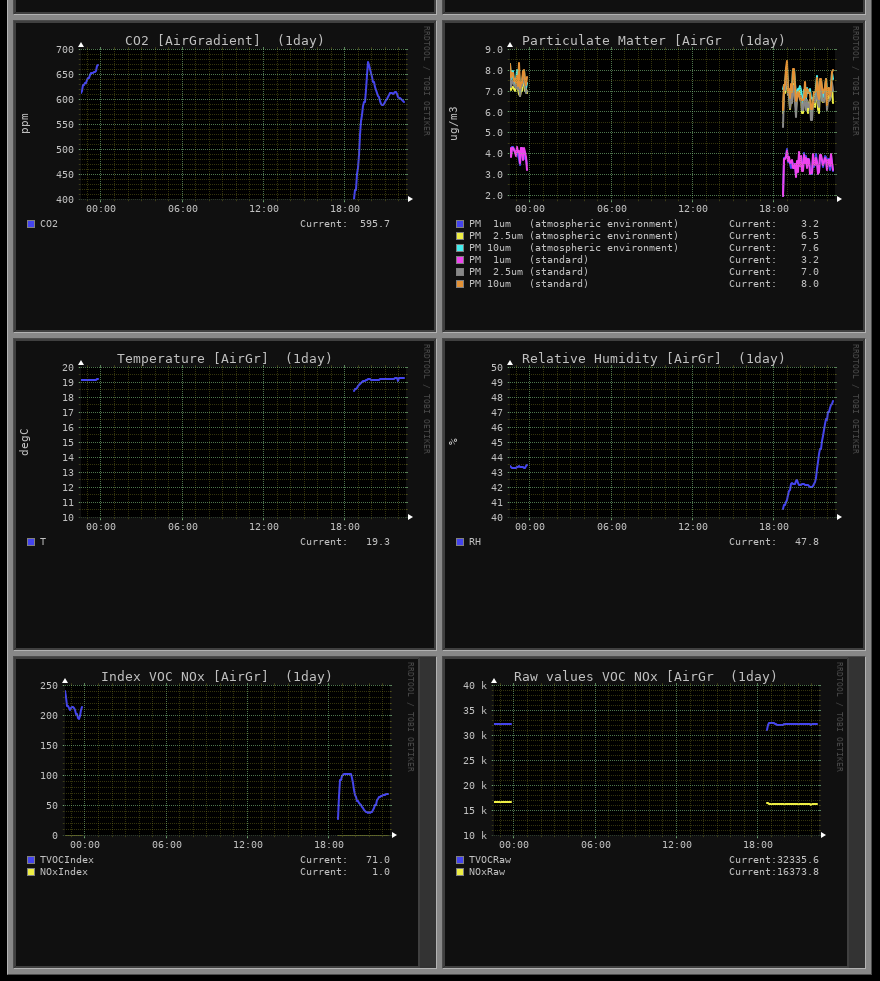
Screenshot
Hardware
The Air Gradient monitor is connected to a single-board computer with the provided USB cable. Any standard 500mA USB port will be enough to power the device.
This SBC is turned off whenever I don’t need it which explains the missing data in the screenshot above.
Software
The setup leverages my existing installation of Monitorix, “a free, open source, lightweight system monitoring tool” coupled with the data streamed by the Air Gradient monitor on its serial line.
Basically, it greps the pattern I want to record and prints the value to standard output which is then used by Monitorix to feed its databases.
So I have a bunch of oneliners like so:
$ ls ag*
ag_CO2.sh ag_PM01.sh ag_PM02.sh ag_PM10_S.sh ag_tvoci.sh
ag_noxi.sh ag_PM01_S.sh ag_PM02_S.sh ag_rh.sh ag_tvocr.sh
ag_noxr.sh ag_PM02_C.sh ag_PM10.sh ag_temp.sh
Which all looks like this:
grep -m 1 'CO2{1}:' /dev/ttyACM0 | awk -F" " '{print $2}'
where CO2{1}: is to be changed to the pattern you want and /dev/ttyACM0 is the device where you can read the datastream from the monitor. You can try cat /dev/ttyACM0 to get an idea of how it looks.
Then on the Monitorix side, I use the “Ambient sensor” section (excerpt from monitorix.conf):
# AMBSENS graph
# -----------------------------------------------------------------------------
<ambsens>
        list = Current, Voltage, CO2 [AirGradient], Particulate Matter [AirGradient], Temperature [AirGr], Relative Humidity [AirGr], Index VOC NOx [AirGr], Raw values VOC NOx [AirGr]
        <desc>
                0 = I_PSU, I_BATTERY
                1 = U_PSU, U_BATTERY
                2 = CO2
                3 = PM1, PM25, PM10, PM1_S, PM25_S, PM10_S
                4 = T
                5 = RH
                6 = TVOCIndex, NOxIndex
                7 = TVOCRaw, NOxRaw
        </desc>
        <units>
                0 = uA
                1 = uV
                2 = ppm
                3 = ug/m3
                4 = degC
                5 = %
                6 =
                7 =
        </units>
        <cmd>
                I_PSU = /home/username/scripts/i_psu.sh
                I_BATTERY = /home/username/scripts/i_battery.sh
                U_PSU = /home/username/scripts/u_psu.sh
                U_BATTERY = /home/username/scripts/u_battery.sh
                CO2 = /home/username/scripts/ag_CO2.sh
                PM1 = /home/username/scripts/ag_PM01.sh
                PM25 = /home/username/scripts/ag_PM02.sh
                PM10 = /home/username/scripts/ag_PM10.sh
                PM1_S = /home/username/scripts/ag_PM01_S.sh
                PM25_S = /home/username/scripts/ag_PM02_S.sh
                PM10_S = /home/username/scripts/ag_PM10_S.sh
                T = /home/username/scripts/ag_temp.sh
                RH = /home/username/scripts/ag_rh.sh
                TVOCIndex = /home/username/scripts/ag_tvoci.sh
                TVOCRaw = /home/username/scripts/ag_tvocr.sh
                NOxIndex = /home/username/scripts/ag_noxi.sh
                NOxRaw = /home/username/scripts/ag_noxr.sh
        </cmd>
        <map>
                PM1    = "PM  1um   (atmospheric environment)"
                PM25   = "PM  2.5um (atmospheric environment)"
                PM10   = "PM 10um   (atmospheric environment)"
                PM1_S  = "PM  1um   (standard)"
                PM25_S = "PM  2.5um (standard)"
                PM10_S = "PM 10um   (standard)"
        </map>
        <alerts>
        </alerts>
        graphs_per_row = 2
        rigid = 0
        limit = 100
</ambsens>
Note that the voltage and current stuff have nothing to do with the Air Gradient monitor: it is the monitoring of the battery of the computer where the Air Gradient monitor is plugged in and which hosts the Monitorix instance.
Possible improvements
- develop a proper Monitorix plug-in to get nicer colors, more stats (min, max, average and so on), possibly define limits to mimick air quality info (as conveyed by the LEDs on the device). But I know nothing about perl and what I have today fits my needs.
- an alternative would be to configure directly rrdtool to record and graph the data. I spent a bit of time trying to but really this is going down a rabbit hole and I got nowhere easily

Hope someone will find this useful 