After two weeks with data collected, I can now share some initial insights with these numbers here.
TL;DR - a few key takeaways:
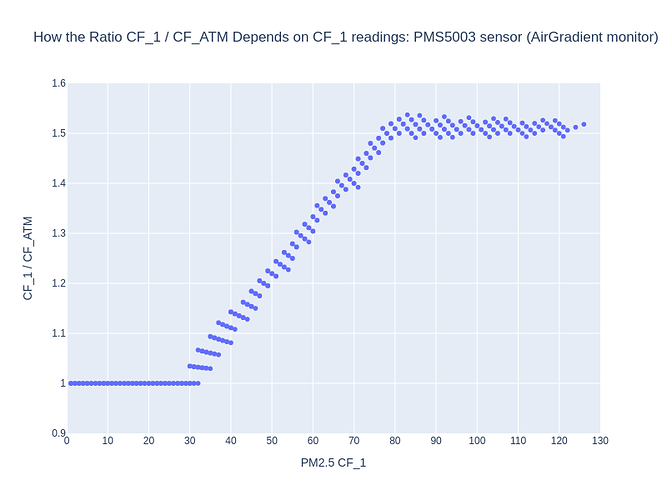
- Reproduced CF_1 / CF_ATM ratio dependence on CF_1 readings (as reported by Dr. Wallace - link)
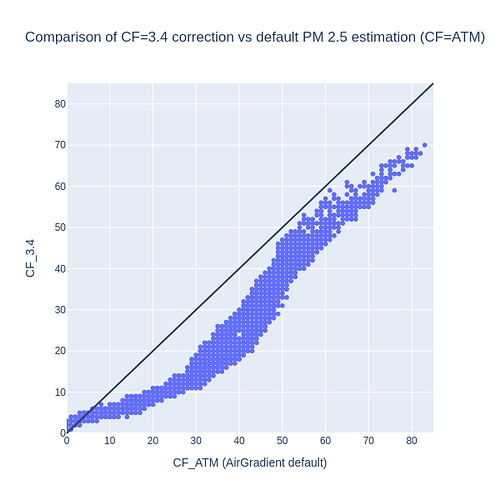
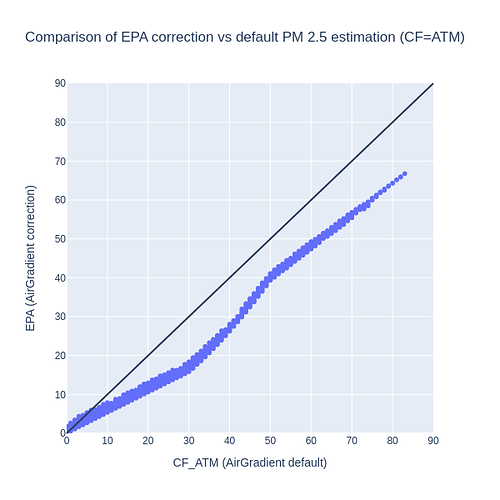
- CF=ATM (current AG default) overestimates PM 2.5 readings in comparison to CF=3.4 and EPA
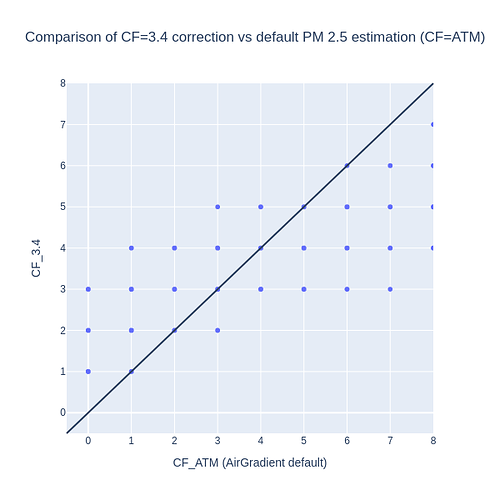
- When PM 2.5 is below 5 μg/m³ , all methods seem to yield more similar values (including CF=ATM)
- Although at values below 2 μg/m³ , CF=ATM seems to rather underestimate PM 2.5 (vs EPA or 3.4)
- CF=3.4 never seems to return any zero-values, whereas others do (CF=ATM enforces this)
- EPA wouldn’t return zero-values either, but if one rounds them to integer, it will happen too
My first goal was to try to replicate the plot by Dr. Wallace on the CF=1 / CF_ATM ratio as implemented in PMS5003 sensors. His data was obtained with PurpleAir monitors, but as AirGradient indoor monitors share the same sensor, I thought this would be a nice initial sanity check for the data I’m getting.
So this looks as expected. But please note that it only works if one selects raw data to be exported from the server (as this indeed seems to be raw, even though only sampled once per minute). For any other selection (e.g. 5 min), the data seem to be averaged and the plot above will look different.
Ok, after that, I wanted to compare the alternative correction formulas (CF=3.4 and EPA) in comparison to the current default readings of the AirGradient monitor (CF=ATM) - although I’m aware that the team is working to have the EPA values by default soon  :
:
A) CF=3.4
In this case, we observe that almost all values are below the diagonal line, and thus can conclude that, within this PM 2.5 range ([0, 85] PM2.5 CF=ATM), the CF 3.4 correction consistently yields lower values.
The only exception for that observation is in very low PM 2.5 values, as zoomed in below:
So two interesting observations from the zoomed in image: (i) for PM 2.5 values below 5, the CF=3.4 would produce more similar results as the AG default estimation (and the latter will get greater values if CF=ATM below 2); (ii) the CF=ATM (curret AG default) can also result on zero values, which is not the case for the CF=3.4 alternative.
The zero-values from CF=ATM is discussed in the paper Cracking the code—Matching a proprietary algorithm for a low-cost sensor measuring PM1 and PM2.5. Dr. Wallace seems to have found the code behind the PMS5003 CF=ATM and CF=1 estimations, and observed that the CF=ATM could result on negative values, but were then rather converted to [artificial] zero values.
And a bonus observation here is that all values were rounded due to being treated as integer. For very low values, maybe one could argue that having float numbers would be beneficial instead, I believe.
B) EPA (Correction Algorithms)
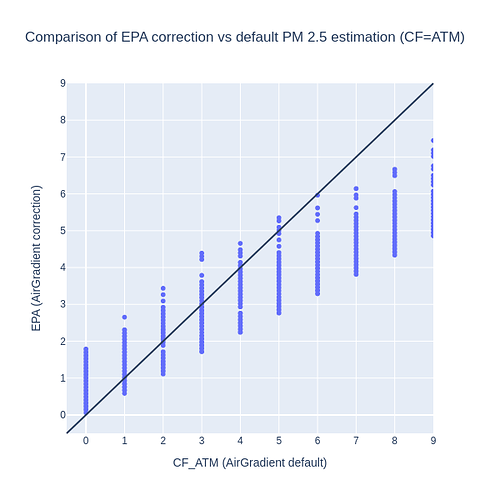
Similar as the comparison with CF=3.4 , we observe that the current AirGradient values may be overestimating PM 2.5 in respect to the EPA correction formula. Another similar observation is that the CF=ATM values will get more similar to the EPA formula when dealing with quite low values (up to 5 μg/m³). And then the pattern inverts around 0-2 values, as shown below:
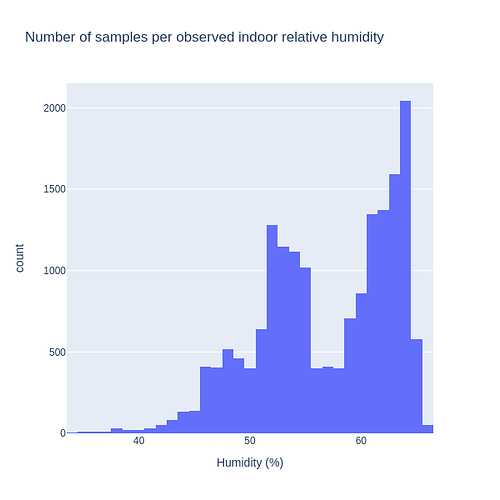
As EPA also depends on the relative humidity, this is an histogram of my indoor RH for that data:
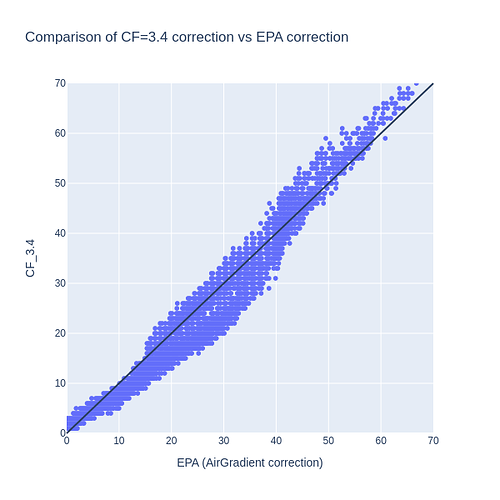
So now one final interesting comparison is to see how CF=3.4 behaves in respect to the EPA correction:
Both methods seem to yield quite consistent PM 2.5 values, I’d say, based on the spread around the diagonal line. Maybe we could say that EPA tends to return slightly higher PM values at concentrations between 5 and 40 μg/m³, and above that the pattern inverts - CF=3.4 returns slightly higher values instead. Although those deviations seem to be within 10 μg/m³ from one another.
So this concludes it. If anyone is interested in any further comparisons, I’d be glad to create more plots.
 When I was trying to replicate the results of the EPA formula, I found some issues with casting of integer to float in C++ (I’m used to Python programming instead, which is not so strict as C++).