Hello,
For the first time I was looking into the tVOC readings from my outdoor monitor, and observed a consistent oscillation pattern seemingly associated with day/night hours, as shown below:
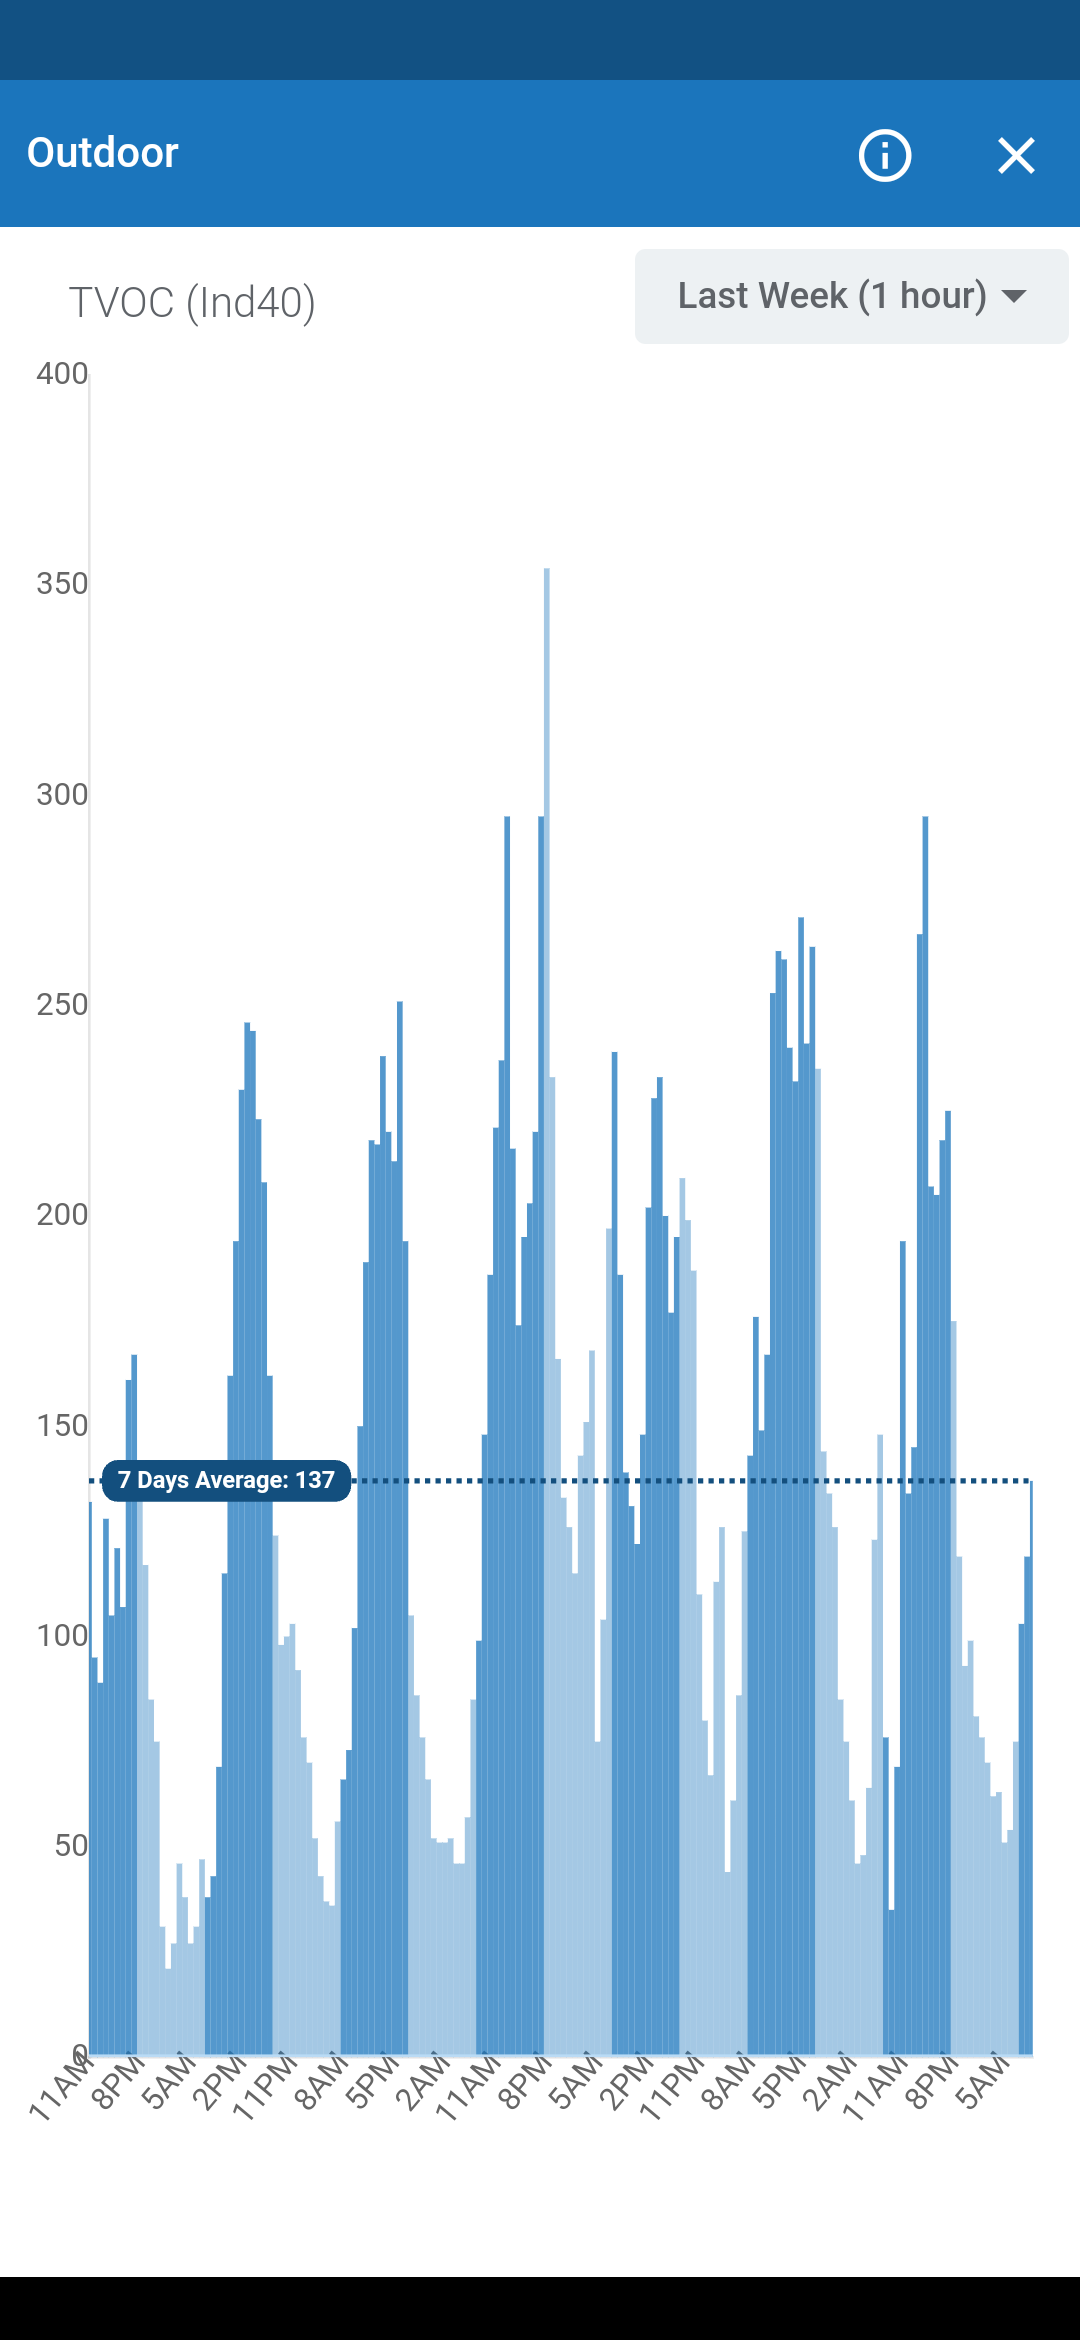
Dark bars are day hours and light ones are night hours. I think it is fair to interpret that tVOC tend to considerably increase during the day here. And I was wondering whether if others have already observed this, i.e. if it’s an expected pattern or something I may need to worry about.
As some additional context, I have the baseline set to 720 hours, the monitor is not facing any direct sunlight, and I was not able to observe clear association with either any of the other metrics measured.
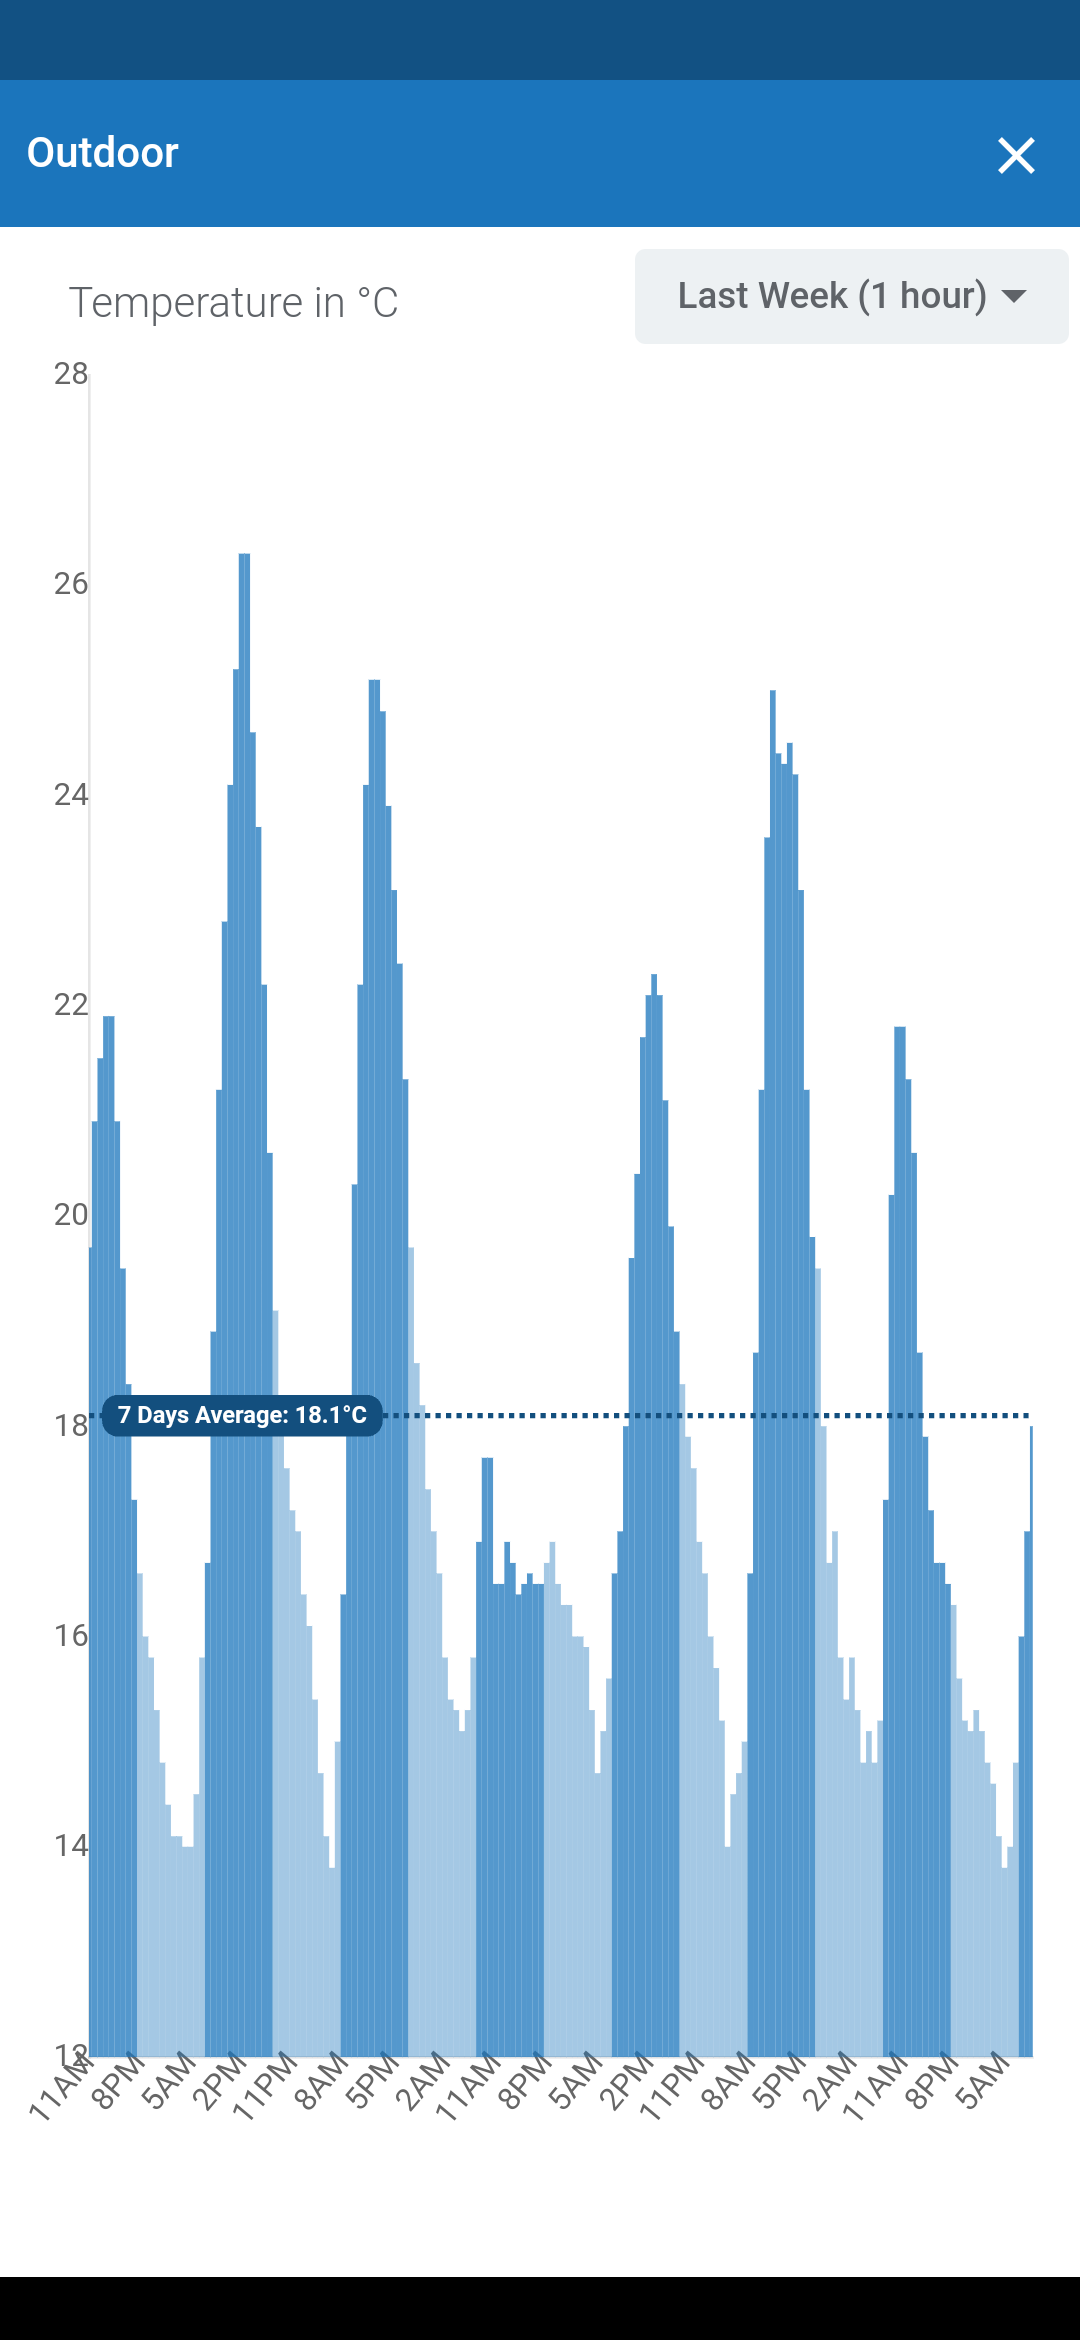
An obvious candidate here would have been the temperature itself, which indeed presents very similar pattern, except for one day, the forth one - because the temperature rather didn’t increase that much as the others, while tVOC did regardless. Temperature plot is below.
Same for relative humidity, which could have had a negative correlation, but for the same day doesn’t seem to hold true either:
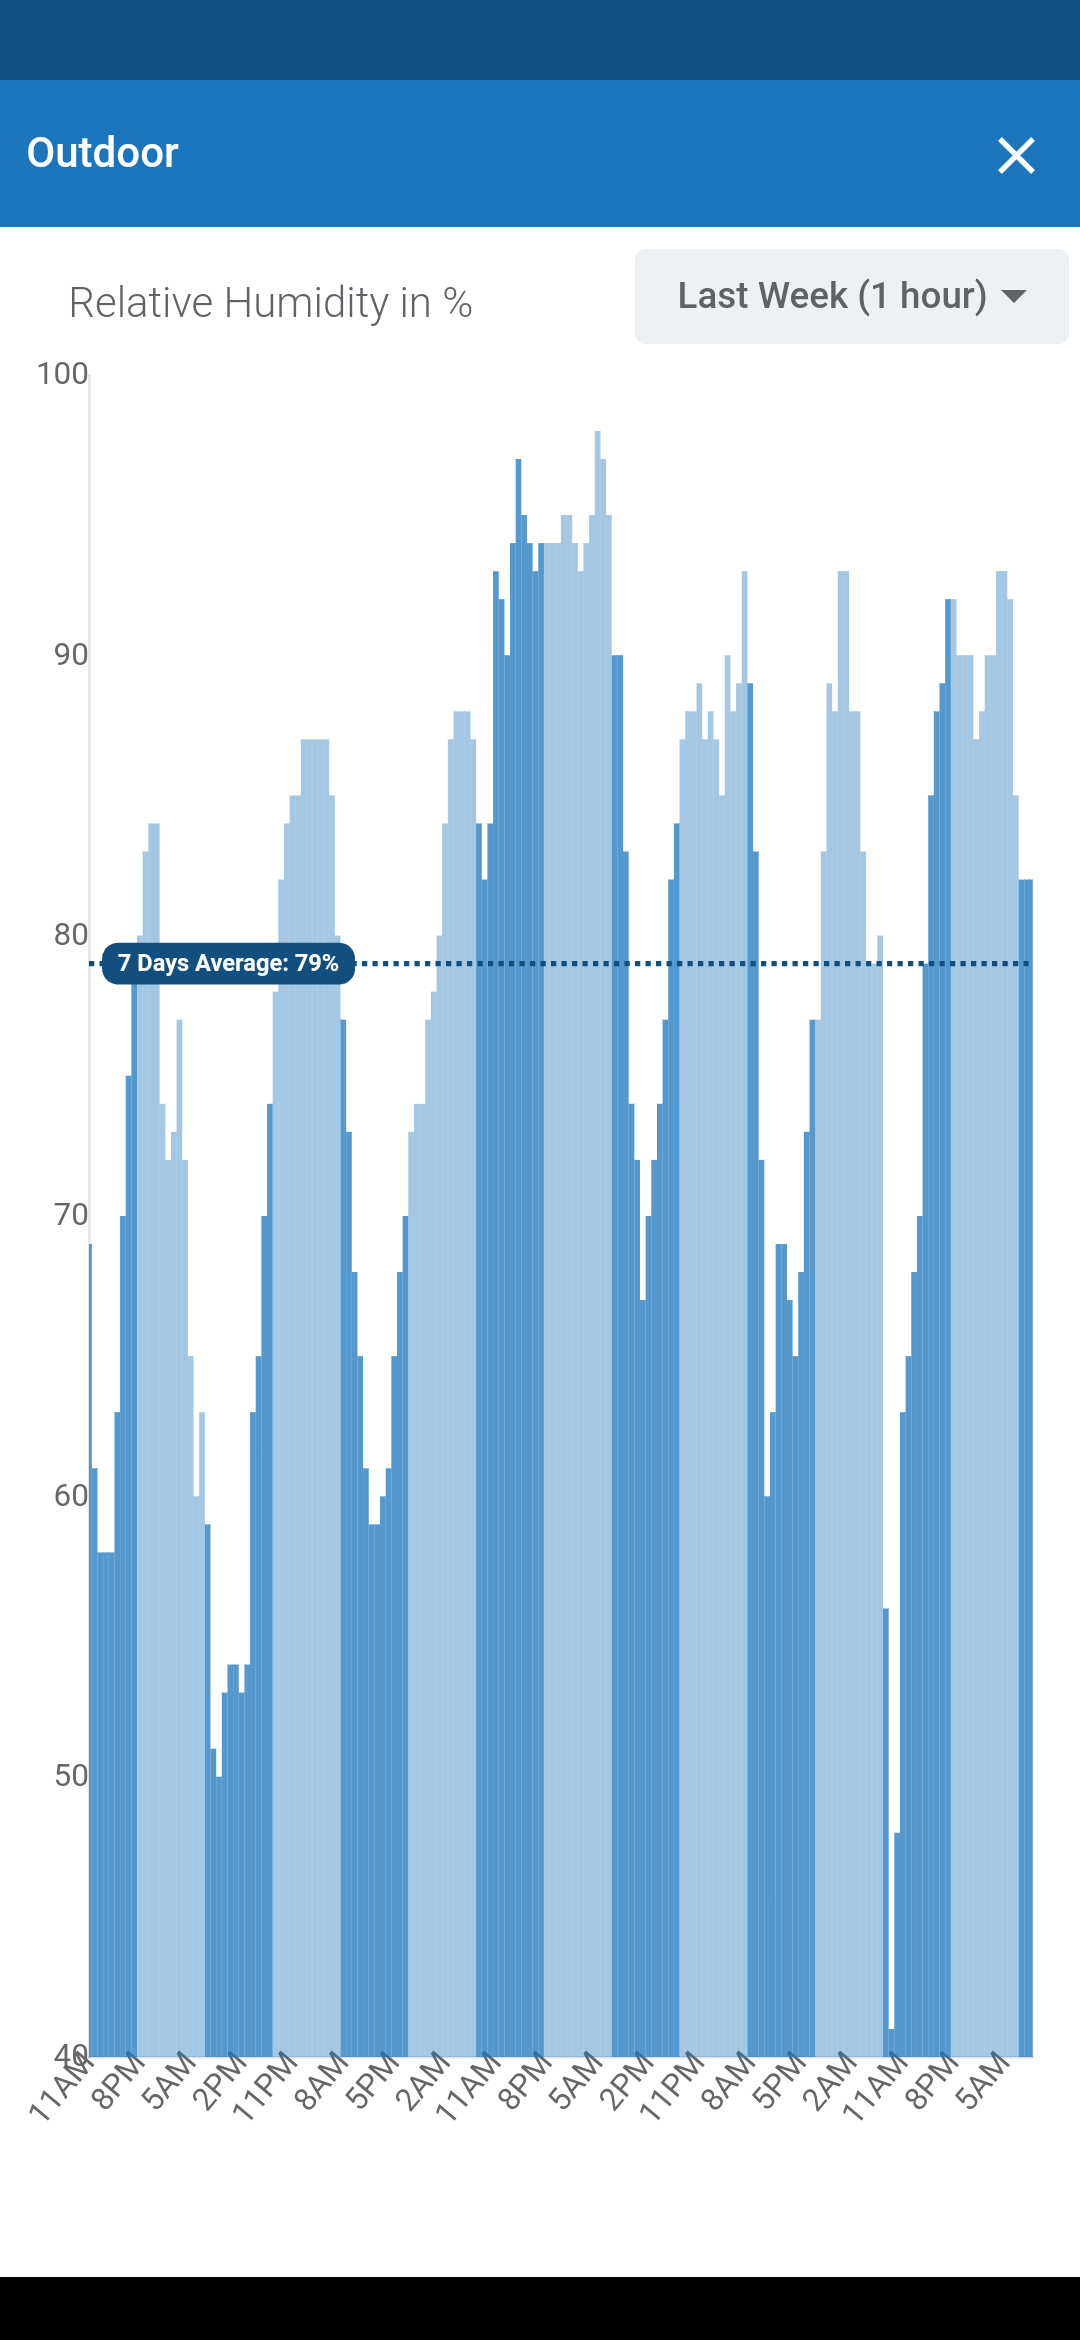
(Note however that both temperature and RH are from the PMS5003T which are uncorrected and may not represent the actual outdoor temperature)
I also quickly read in the internet that it could be due to photochemical reaction. I have not tried to check yet if these readings would correlate with amount of sunlight recorded (by a reference device) each day though.
But I did also check the NOx readings and couldn’t find any clear association (again based on visual inspection only at this moment).
Any thoughts? I’m curious to try to learn it better. Although I also understand it’s quite difficult to interpret the tVOC readings already indoors, and may be even more complex to identify the outdoor source. But I found this consistent behavior to be quite interesting.