I think currently it’s not adjustable. Would you need a much faster frequency?
Not much. But it would be nice to have, for example, 4 times a minute.
I use CO2 sensors to automate ventilation. I try to analyze not only the current value, but also average and trend. Once a minute is a little bit rare.
Please open an issue on our HA github.
Joost already answered. It seems it’s already possible.
I confirm it works.
2 Likes
Two more points about update frequency.
-
For testing I followed the instruction above for one of my ONE devices.
I disabled default polling in HA.
I wrote automation that calls homeassistant.update_entity for one of the device sensors every 10 seconds. As I can see, all the device sensors are updated once in 10 seconds now.
Is that the way I should work, or do I need to list all 33 entities of the device when calling update_entity? -
How often are the real measurements made?
I have IQAir Airvisual device. It makes measurements only once in 3 minutes. I can poll them from HA every second if I want to, but they will always be the same.
If I poll data from Airgradient device frequently, will every poll return the new measurement? Or the measurements will be made, for example, once in 10 seconds? May be, the answer is different for different sensors?
Can’t answer for 1st point. But for the 2nd, yes device will return a new measurements but the value can be the same (depends on measurements result). The device have a scheduler to read from each sensor (time is different for each sensor), but all scheduled under 10s.
Thanks for your answer.
Where can I find these sensor reading schedules?
Its embed on the firmware and cannot be changed, unless you modify the firmware yourself. You can see it here arduino/examples/OneOpenAir/OneOpenAir.ino at 3.1.9 · airgradienthq/arduino · GitHub
1 Like
HI - is there a specific card for home assistant that presents the data nicely? If not are there any suggestions for which existing cards would work best?
Thanks,
Michael
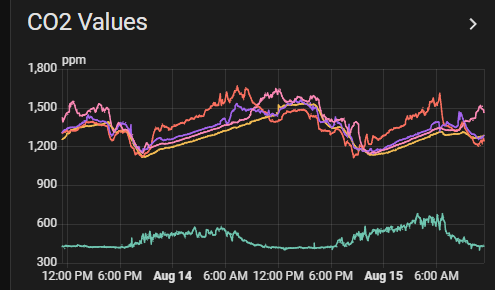
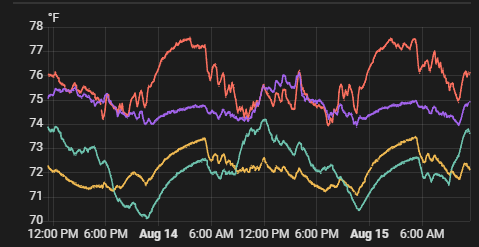
No specific card, but I do history-graph cards for tracking most sensors to see it over the last 48 hours
1 Like
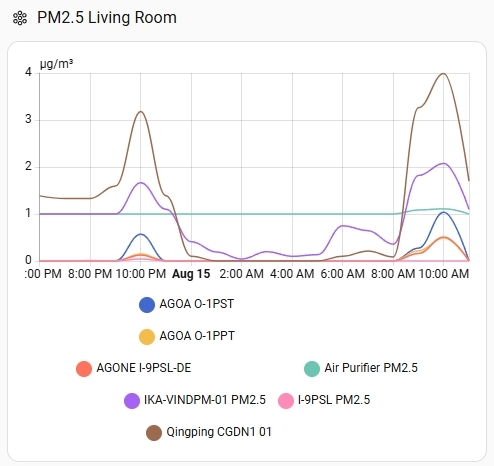
Hi Michael, for me, I’m using Statistics Graph Card in my HA dashboard and it’s quite satisfying. It allows you to add multiple sensors, adjust time period, stat types, chart type, etc. It looks beautiful and simple, so I’m happy with it.
Here’s mine:
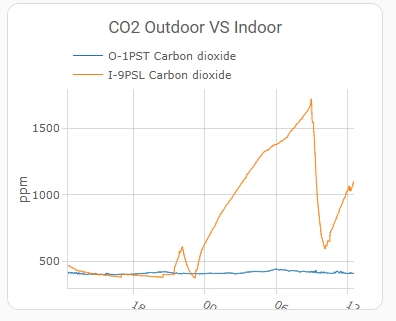
Another option in case you need something more advanced, a custom card named ‘Plotly Graph Card’ is a good choice (I installed mine via HACS). This one is more interactive, but might be resource-consuming sometimes (stuttering happens when you interact with the chart), maybe it also depends on the machine you use to run HA.
1 Like
history-graph
1 Like
Thanks all - these are great examples. I look forward to tryout these options.
1 Like