AirGradient Forum

Max API - Working example with O₃ and NO₂ data

AirGradient Open Air Max API: looking for a working example with O₃ and NO₂ data

Could any team member in AirGradient please share documentation, examples, or forum posts showing API access to a real AirGradient Open Air Max station, ideally including O₃ and NO₂? You are welcome to share these here or by email.

I searched online and used AI to find relevant information. I managed to retrieve PM and other measurements from public devices, but could not find a clear, working example with O₃ and NO₂ readings.

We do have an air quality data system platform. But we do not currently own AirGradient devices, but may obtain them or integrate existing stations into our system. Our third-party developers are nearing completion of the system, and major changes may be difficult later. We would therefore like to test at least one Max integration now and identify any requirements before development ends.

Programming and advanced API work are outside my main area of work. I can manage some tasks, but they take time alongside my other duties. Our developers may also have limited time for further investigation, so I am trying to gather clear examples and guidance to help them implement the integration.

Could you please help with:

  1. A real or demonstration Max station for testing, with a station link and API access to all available parameters, particularly O₃ and NO₂.
  2. The API endpoint, Location ID and sample JSON response, with relevant documentation and authentication or access requirements.
  3. Guidance on update intervals and hourly data, if available and if necessary (Optional), including the Max’s sampling and batch transmission behaviour.

If O₃ and NO₂ readings are unavailable through the public API, are they accessible through authenticated access or another supported method? or !?

If email would be more suitable, particularly for arranging private test access, please suggest a contact person or email address.

Thank you for your assistance. Details of a working example would be especially helpful given our limited timeline.

Best regards,
Akila DJ

Hi @Akila, thank you for reaching out to us.

Please let me check with our team whether it is possible to get the O3 and NO2 readings via the cloud API (I tried it with my Open Air Max (O-M-1PPSTON-CE). The API doesn’t expose the O3 and NO2 readings as you mentioned)

Regarding the Open Air Max’s update interval, please check out these articles:

I will get back to you as soon as possible once I have an update from the team. Thanks!

1 Like

Hi again @Akila, we have enabled NO2 and O3 to be exposed to the cloud API for the Open Air Max.

Here are examples of the two endpoints that have NO2 and O3 exposed:

  • GET /public/api/v1/world/locations/{locationId}/measures/current

Response body

{
  "locationId": 123456,
  "locationName": "Example Location",
  "publicLocationName": "Example Public Location",
  "latitude": 0.0,
  "longitude": 0.0,
  "offline": false,
  "pm01": 5.3,
  "pm02": 7.3,
  "pm10": 7.5,
  "pm003Count": 983,
  "atmp": 14.8,
  "rhum": 87,
  "rco2": 526,
  "tvoc": null,
  "wifi": -49,
  "timestamp": "2026-09-15T05:49:58.000Z",
  "tvocIndex": 34295,
  "noxIndex": 18097,
  "heatindex": 15,
  "placeId": 99999,
  "publicPlaceName": null,
  "publicPlaceUrl": null,
  "publicContributorName": "Example Contributor",
  "timezone": "Asia/Bangkok",
  "model": "O-M-1PPSTON-CE",
  "firmwareVersion": null,
  "no2": 17.7,
  "o3": -17.9
}

Please note that NO2 and O3 are shown in PPB for this endpoint. Please ignore the negative value.


  • GET /public/api/v1/locations/{locationId}/measures/current

Response body

{
  "locationId": 123456,
  "locationName": "Example_Location",
  "locationType": "outdoor",
  "latitude": 0.0,
  "longitude": 0.0,
  "pm01": 5.3,
  "pm02": 7.4,
  "pm10": 7.5,
  "pm01_corrected": 5.3,
  "pm02_corrected": 4.4,
  "pm10_corrected": 7.5,
  "pm003Count": 1110,
  "atmp": 15.1,
  "rhum": 87,
  "rco2": 523,
  "atmp_corrected": 15.1,
  "rhum_corrected": 87,
  "rco2_corrected": 523,
  "wifi": -48,
  "timestamp": "2026-09-15T05:58:59.000Z",
  "timezone": "Asia/Bangkok",
  "serialno": "00000example",
  "model": "O-M-1PPSTON-CE",
  "firmwareVersion": null,
  "tvoc": null,
  "tvocIndex": 34428,
  "noxIndex": 18379,
  "batteryVoltage": "12.25",
  "panelVoltage": "17.18",
  "o3WorkingElectrode": 383.7125,
  "o3AuxiliaryElectrode": 398.4375,
  "no2WorkingElectrode": 306.5125,
  "no2AuxiliaryElectrode": 300.525,
  "afeTemp": 316.3375,
  "o3": -14.725,
  "no2": 27.909033
}

This endpoint also exposes the raw sensor readings.


Learn more about the AirGradient API: Swagger UI

Please feel free to contact us via https://www.airgradient.com/support/ if you have further questions. Thank you!

1 Like

Thank you very much.

I have a question regarding the negative and zero values observed in the NO₂ and O₃ readings.

Could you please clarify why negative values are being reported for these two parameters? I checked several public devices a couple of hours ago and noticed that quite a number of devices were showing zero or negative values, for example:

Location name                                      NO₂ (ppb)    O₃ (ppb)
Kyebando                                             0.0          0.0
Sir Apollo Kagwa Road                                0.0          0.0
Opposite TU Chiang Rak 1 – ชุมชนคุ้งผ้าพับ...            0.0          0.0
South Gate / Bristol Rd                              0.0          0.0
West Gate Bridge                                     0.0          0.0
North Gate                                           0.0          0.0
ESYair Pro                                          14.7         -6.1
CLARO Carlsbad                                      -1.4          9.3
CLARO Artesia                                      -16.9         -6.9
A444 through Overseal                               18.4          0.0

If there are any other suitable public devices? pls do share.

In addition to the reason for negative values,
I would also like to clarify the meaning of a value of exactly 0.0 ppb.

Does 0.0 mean:

  1. The actual measured concentration is zero?
  2. The concentration is very close to zero?
  3. The value is below the sensor’s minimum detection limit or measurable range?
  4. Sensor not available / not working.
  5. No data / absence of data / unavailable measurement?
  6. Or is it the result of some processing, rounding, correction, or clamping of the sensor output?

This is quite important for us because the interpretation of zero and negative values can have a significant impact on how the data are used and communicated, especially when the data are being used for air-quality monitoring and public dissemination.

I also think it would be useful to consider the time at which the values are checked when assessing whether they look reasonable. NO₂ and O₃ have strong diurnal patterns, and their concentrations can change considerably throughout the day due to emissions, atmospheric chemistry, sunlight, and other factors. Therefore, a snapshot from one particular time may not necessarily be representative of the normal behaviour of the sensor or the location.

The answers may already be available somewhere in the documentation, but since this is quite important for interpreting the data correctly, I thought it would be better to ask here as well. :slight_smile:

Thank you!

1 Like

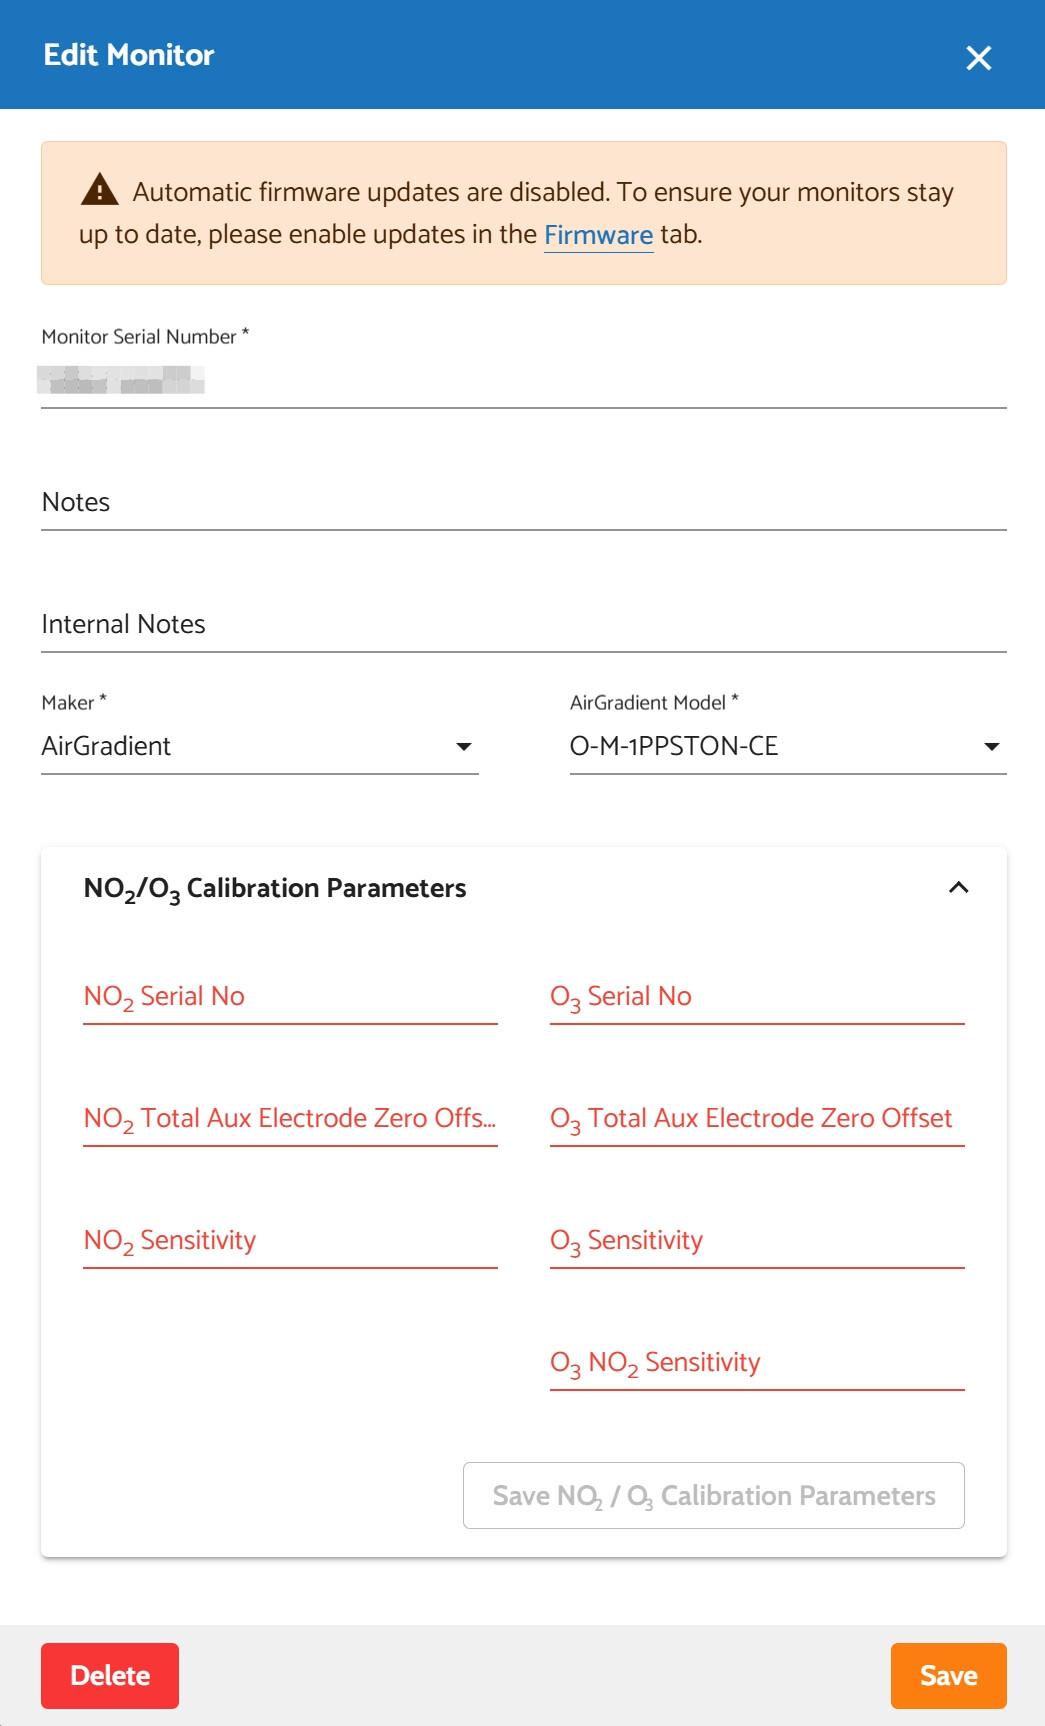
Hi @Akila, the monitors you see with 0.0 readings don’t currently have a calibration parameter applied for NO2 and O3. We may consider these monitors unavailable for NO2 and O3 readings.

Regarding the negative value, please let me consult our team for an accurate answer, and I will let you know the update.

Thank you!

1 Like

Hi @Akila, I hope you are doing well.

I have consulted our scientist about this. She informed me that the correction factor for O3 is not yet ready. We suggest ignoring O3 for now.

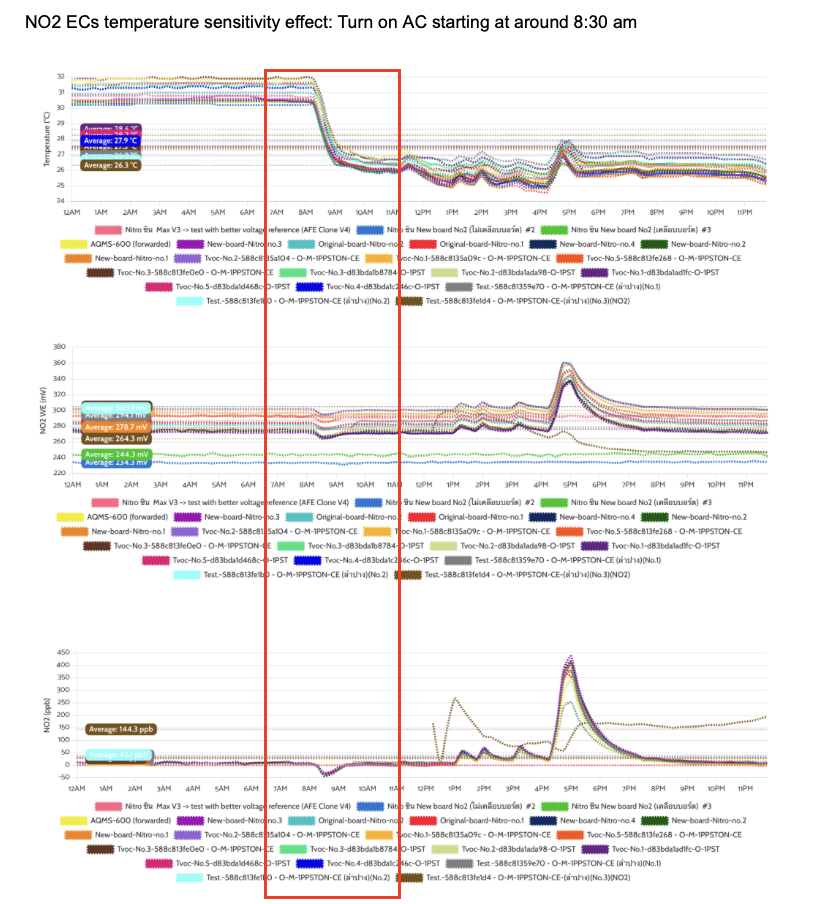
NO2 reading is currently functional. There could be times when it temporarily shows negative values, especially when there is an abrupt change in ambient temperature (for example, when you have just turned on an AC), which causes a temperature sensitivity effect. You will want to wait until the temperature stabilizes and the reading returns to normal (non-negative value).

The temperature sensitivity effect is shown in the charts above.

We also temporarily enable API access to an Open Air Max in our lab so you can learn more about it:

Location ID 194928 https://api.airgradient.com/public/api/v1/world/locations/194928/measures/current

Feel free to let me know if you would like to know about something else. Thanks!

1 Like

Thank you very much for detailed responses!

1 Like

My pleasure!

Let me know if there’s anything I can help you with.