Hi, good question. This visualization from https://allaboutpai.com/weather/yby.pai.avg.html is part of several on the site. Some of our other visualizations on the main page allow the user to zoom in on specific days/hours with precision. For this visualization, we wanted to help people get an overall view of years/months/hours trends, and so it doesn’t include the ability to drill down to specific days/hours. So for the leap year issue we decided to make the visualization 365px wide and simply not show the last px (December 31st) of non-leap-years. It is not critical for this particular chart to show all days. We thought that would be less confusing than the only “correct” alternative, which would be to leave a blank column at the end of February for all but leap years (making it look like data was missing). Even if we just made our chart 366px wide, that would still not be correct because the columns would be 1 day off for March onward relative to the month labels.
The chart is generated in SVG by code on our server (in Perl!) that is not open source at the moment, but feel free to ask any questions. I’d recommend either generating the whole chart as an image, or generating separate PNG images for each year and using an SVG “image” element to add the PNGs to your chart…initially we used SVG "rect"s for the “pixels” and the file sizes were absurd! Also we experimented with nearest-neighbor scaling of the pixels (effectively what you get with the SVG “rect” based “pixels”) vs interpolated and we found there were different advantages either way.
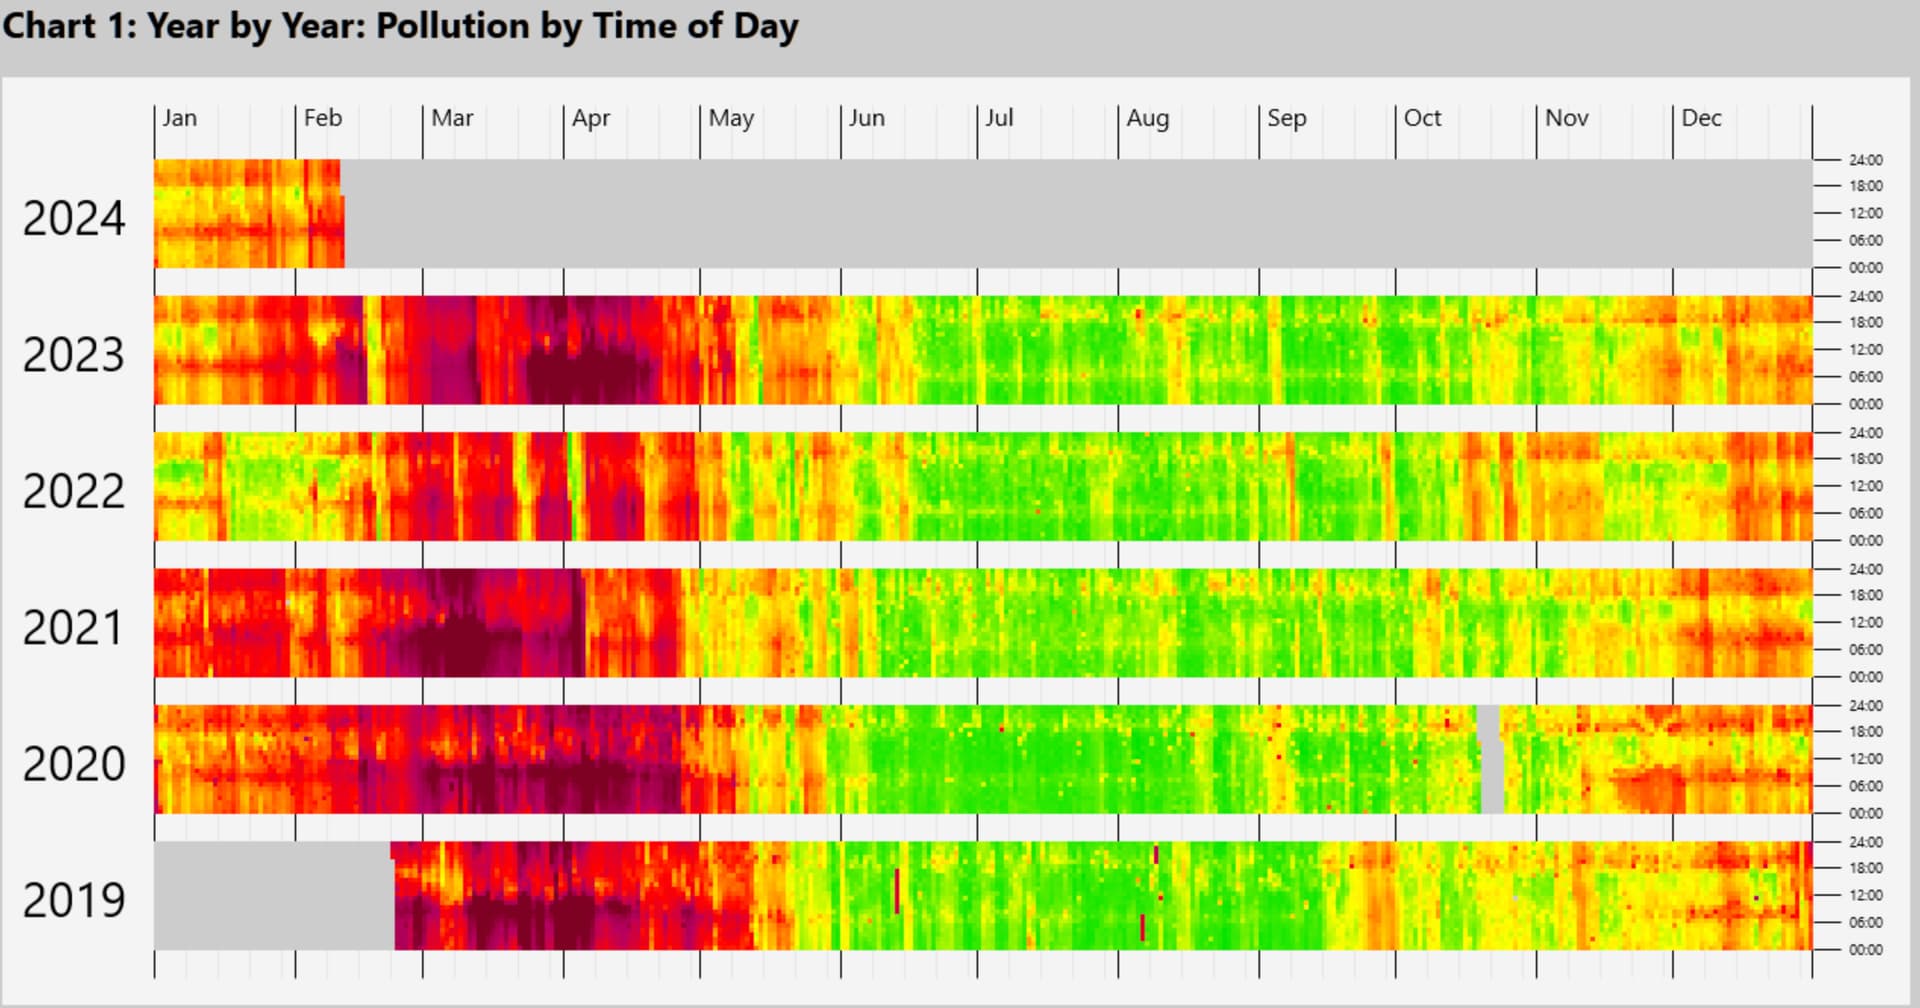
The chart data for each hour is PM2.5 US AQI plotted using the colors seen on the US gov airnow site. The data itself is an amalgam of data from more than 25 Pai stations over 5 years…that was a lot of work!
We only ask that if you use this visualization idea, please give us some credit and a link to https://allaboutpai.com/weather/. Thanks!