Hi all, first time here, but being the main contributer of custombrand icons and having one of these devices I thought I would joing you and share my custom picture entites card for the products.
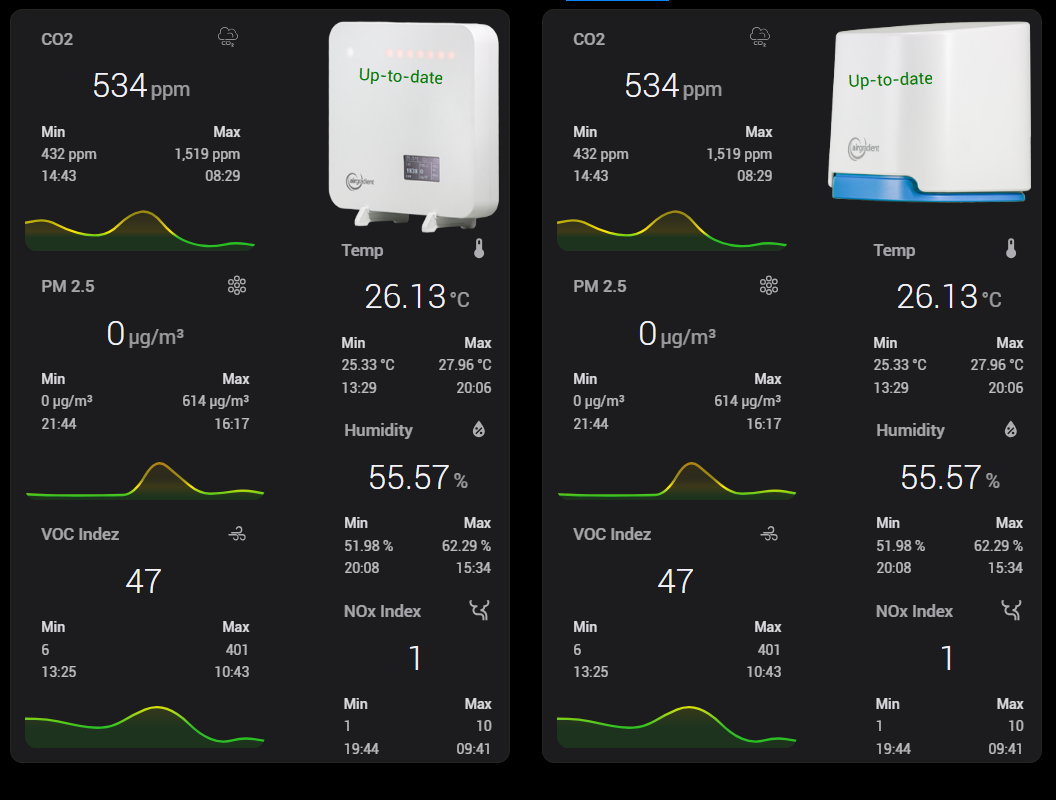
The Lines in the graphs are color coded to the correct levels too.
first you need these 2 images, place them in www (local/images/airgradient
code is
``type: picture-elements
image: /local/images/airgradient/airgradient-one-in.png
elements:
- type: image
entity: sensor.airgradient_one_indoor_pm2_5
image: /local/images/airgradient/airgradient-one-in.png
style:
left: 50%
top: 50%
width: 100% - type: custom:button-card
entity: update.bluetooth_reciever_audio_firmware
show_name: false
show_icon: false
show_state: true
hold_action:
action: default
styles:
card:
- aspect-ratio: 1
- border-radius: 20px
- size: 20%
- box-shadow: none
grid:
- grid-template-columns: 1fr
- grid-template-areas: “” i n s" " i n s" " i n s""
icon:
- size: 20%
state:
- font-size: 100%
- color: |
[[[
if (entity.state === ‘on’) {
return ‘red’;
} else {
return ‘green’;
}
]]]
card_mod:
style: |
ha-card {
box-shadow: none;
background: transparent;
border-width: 0px;
}
style:
top: 09%
left: 78%
rotate: 2.5deg - type: custom:mini-graph-card
name: Temp
entities:- sensor.airgradient_one_indoor_temperature
hour24: true
show:
graph: false
icon: true
extrema: true
fill: false
align_state: center
card_mod:
style: |
ha-card {
box-shadow: none;
background: transparent;
border-width: 0px;
width: 132%;
height: 50%;
}
style:
top: 41%
left: 77%
- sensor.airgradient_one_indoor_temperature
- type: custom:mini-graph-card
name: Humidity
entities:- sensor.airgradient_one_indoor_humidity
hour24: true
show:
graph: false
icon: true
extrema: true
fill: false
align_state: center
card_mod:
style: |
ha-card {
box-shadow: none;
background: transparent;
border-width: 0px;
width: 135%;
}
style:
top: 65%
left: 77%
- sensor.airgradient_one_indoor_humidity
- type: custom:mini-graph-card
name: NOx Index
entities:- sensor.airgradient_one_indoor_nox_index
hour24: true
show:
graph: false
icon: true
extrema: true
fill: false
align_state: center
card_mod:
style: |
ha-card {
box-shadow: none;
background: transparent;
border-width: 0px;
width: 135%;
height: 50%;
}
style:
top: 89%
left: 77%
- sensor.airgradient_one_indoor_nox_index
- type: custom:mini-graph-card
name: CO2
color_thresholds:- value: 700
color: “#2bbf24” - value: 800
color: “#ffe900” - value: 1100
color: “#958a12” - value: 1500
color: “#d37b13” - value: 2000
color: “#ff0000” - value: 3000
color: “#ac0f0f” - value: 5000
color: “#630fac”
entities: - sensor.airgradient_one_indoor_carbon_dioxide
hour24: true
show:
graph: true
icon: true
extrema: true
fill: true
align_state: center
card_mod:
style: |
ha-card {
box-shadow: none;
background: transparent;
border-width: 0px;
width: 77%;
}
style:
top: 16%
left: 33%
- value: 700
- type: custom:mini-graph-card
name: PM 2.5
color_thresholds:- value: 12
color: “#2bbf24” - value: 35
color: “#ffe900” - value: 56
color: “#958a12” - value: 150
color: “#d37b13” - value: 250
color: “#ff0000” - value: 300
color: “#ac0f0f” - value: 500
color: “#630fac”
entities: - sensor.esp32c3_bffdc4_raw_pm2_5
hour24: true
show:
graph: true
icon: true
extrema: true
fill: true
align_state: center
card_mod:
style: |
ha-card {
box-shadow: none;
background: transparent;
border-width: 0px;
width: 80%;
}
style:
top: 49%
left: 33%
- value: 12
- type: custom:mini-graph-card
name: VOC Indez
color_thresholds:- value: 100
color: “#2bbf24” - value: 200
color: “#ffe900” - value: 300
color: “#958a12” - value: 400
color: “#d37b13” - value: 500
color: “#ff0000” - value: 600
color: “#ac0f0f” - value: 700
color: “#630fac”
entities: - sensor.airgradient_one_indoor_voc_index
hour24: true
show:
graph: true
icon: true
extrema: true
fill: true
align_state: center
card_mod:
style: |
ha-card {
box-shadow: none;
background: transparent;
border-width: 0px;
width: 80%;
}
style:
top: 82%
left: 33%`
- value: 100