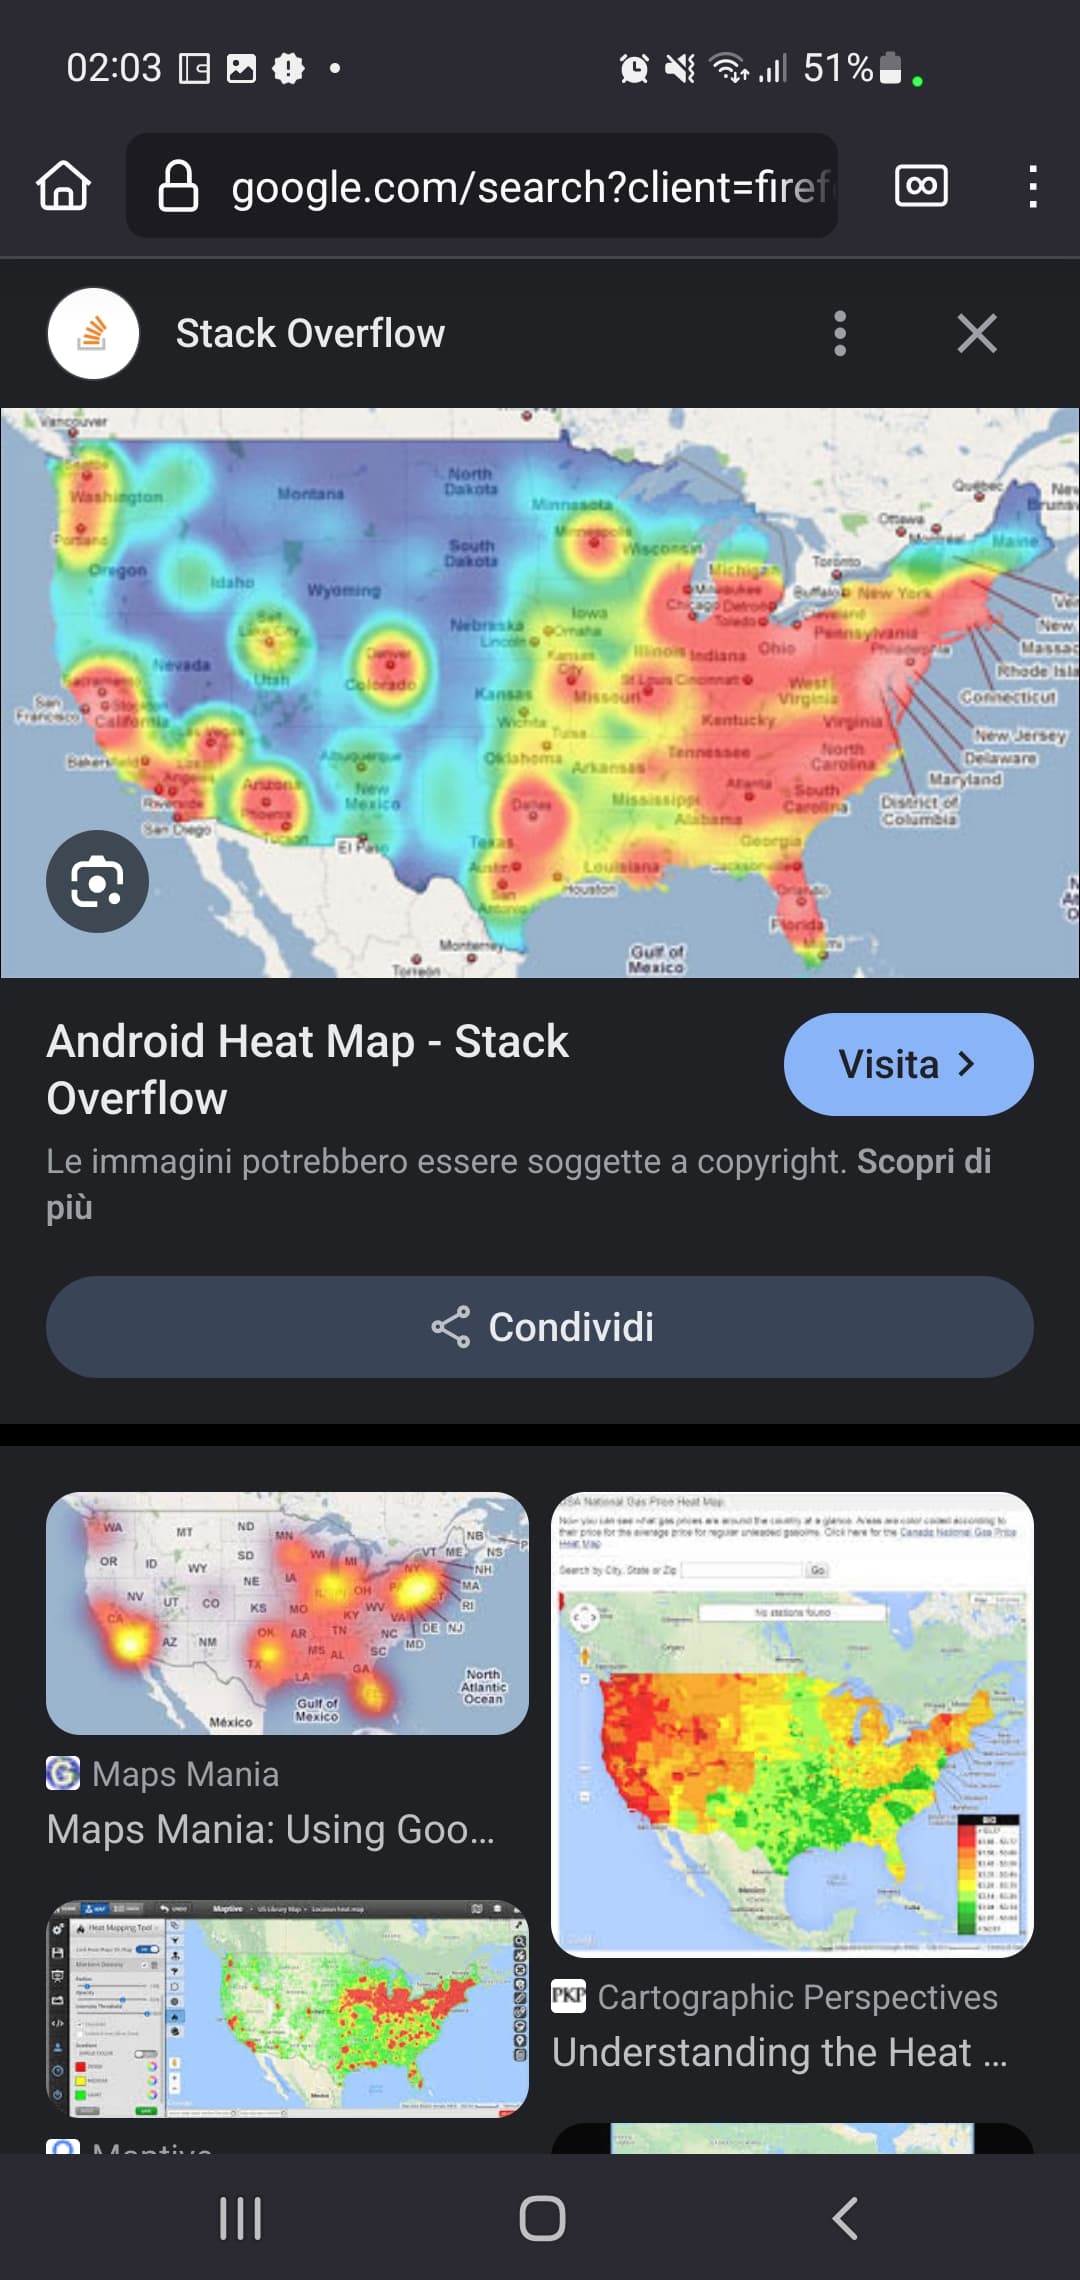
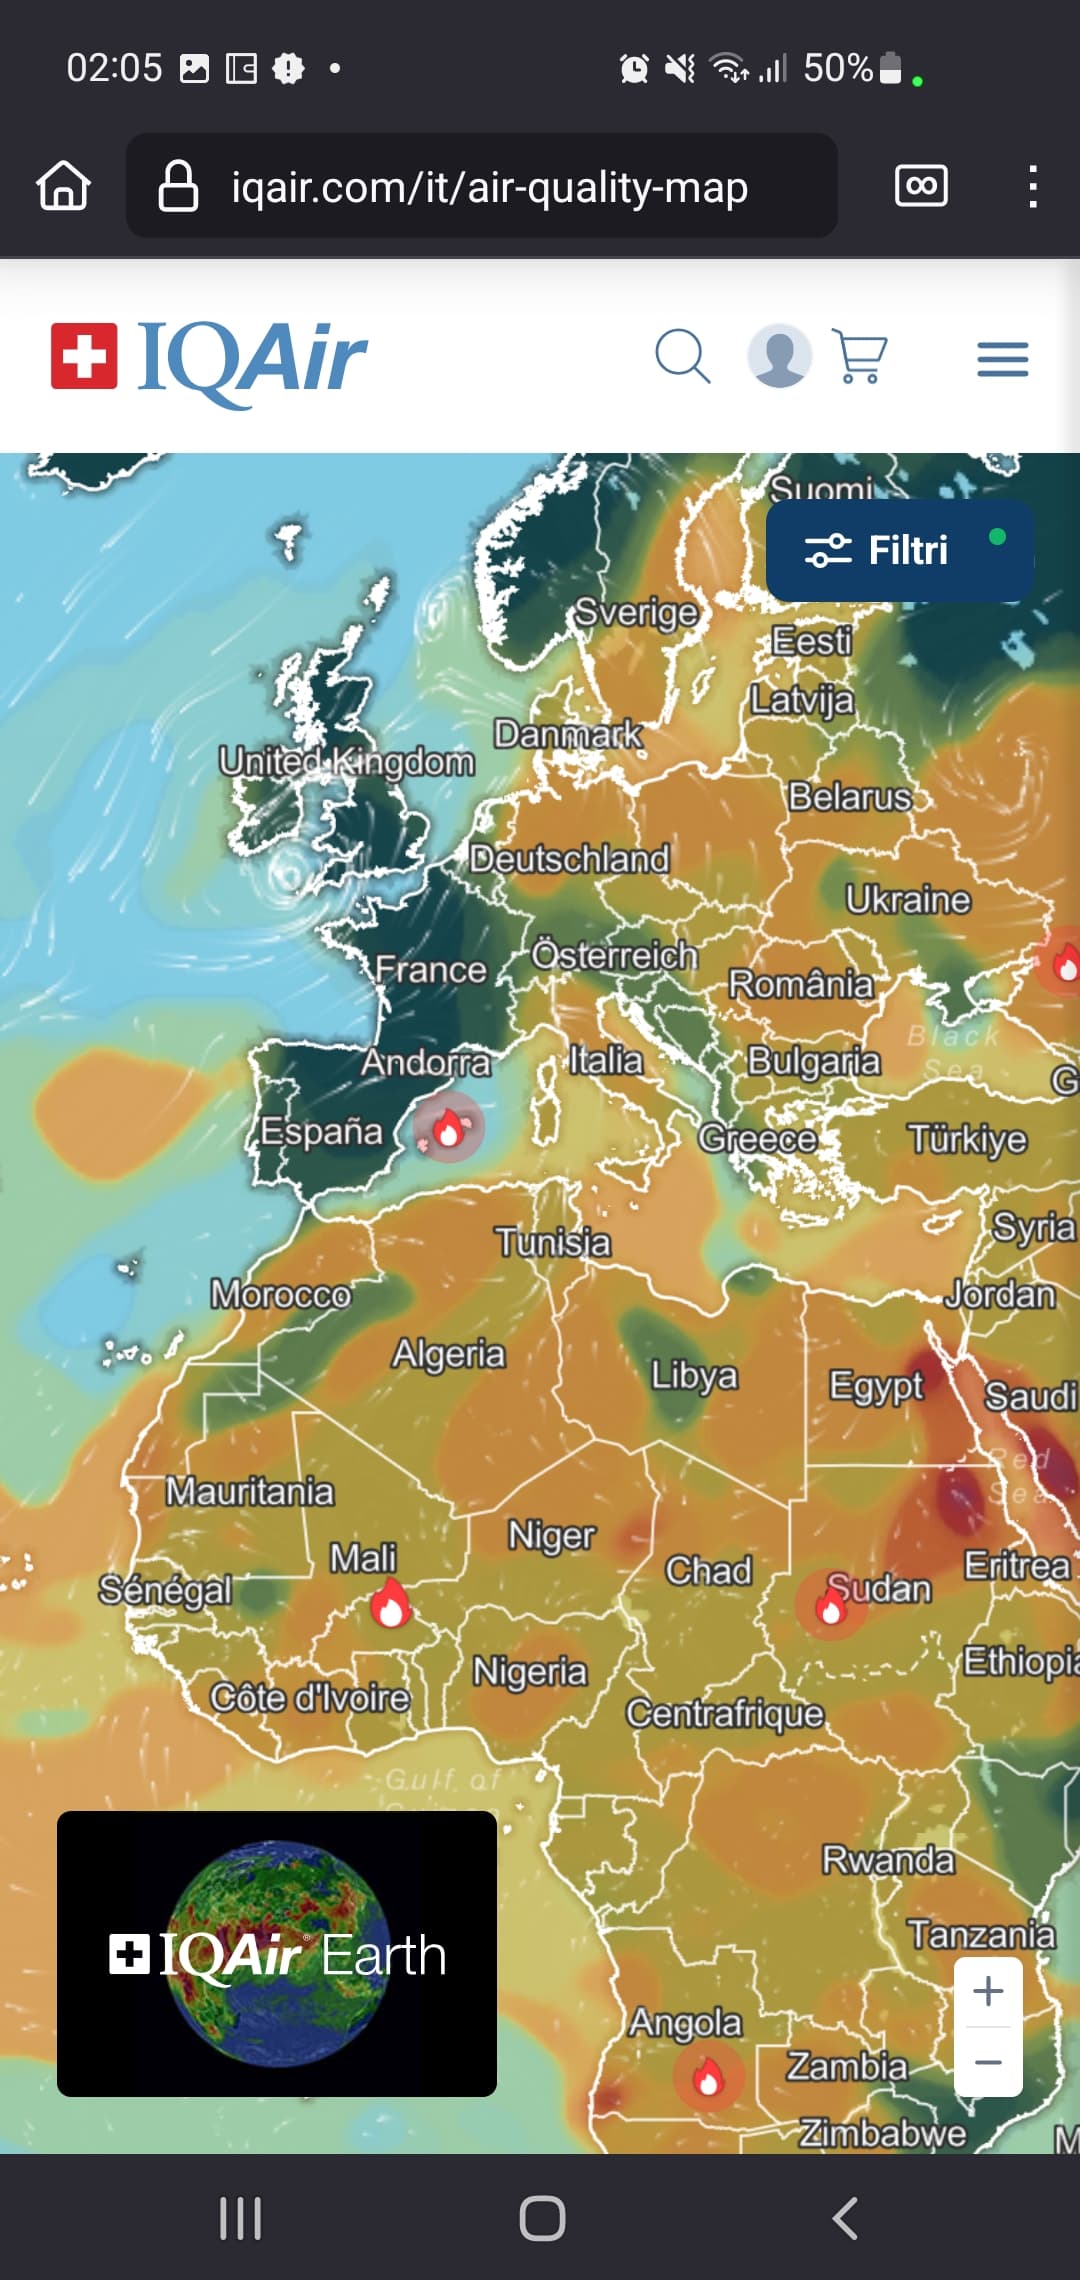
Why not to show airgradient map with color gradient (heatmap) like IQair ?
And why not to add also NOx, temperature, humidity, VOCs instead only CO2 and PMx ?
What exactly do you mean with heat map? Can you share a screen shot?
Is it normal that on AirGradient Map I can see on PMx and CO2 ? How can I see on that map all other data form the sensors purchased ?
Can the MODS give an answer to this query please? It would be nice to understand why there is only a very limited set of the gathered data being shown on the map.
Thanks for the nudge! A quick overview of what’s on the AirGradient Map and why:
What you can see today
- PM2.5, CO₂, Temperature, Humidity — shown because they are the most comparable across locations and easiest to interpret at-a-glance. These also have the clearest health/comfort guidelines.
Why not PM1 / PM10 / TVOC / NOx
-
PM10 and PM1 are not as reliable as PM2.5 as metrics from low-cost optical sensors. PM2.5 is the most accurate and reliable risk indicator for most use‑cases.
-
TVOC & NOx indices (from SGP sensors) are relative indices with sensor‑specific baselines and local sensitivity to indoor sources (cleaners, paints, cooking). They’re great for trend/ventilation diagnostics per room, less so for open map comparison.
2 Likes