The API returns results, it just needs a button added to the existing interface. I assume the charting code will handle the input without much additional work. The other PM sizes could be added as well.
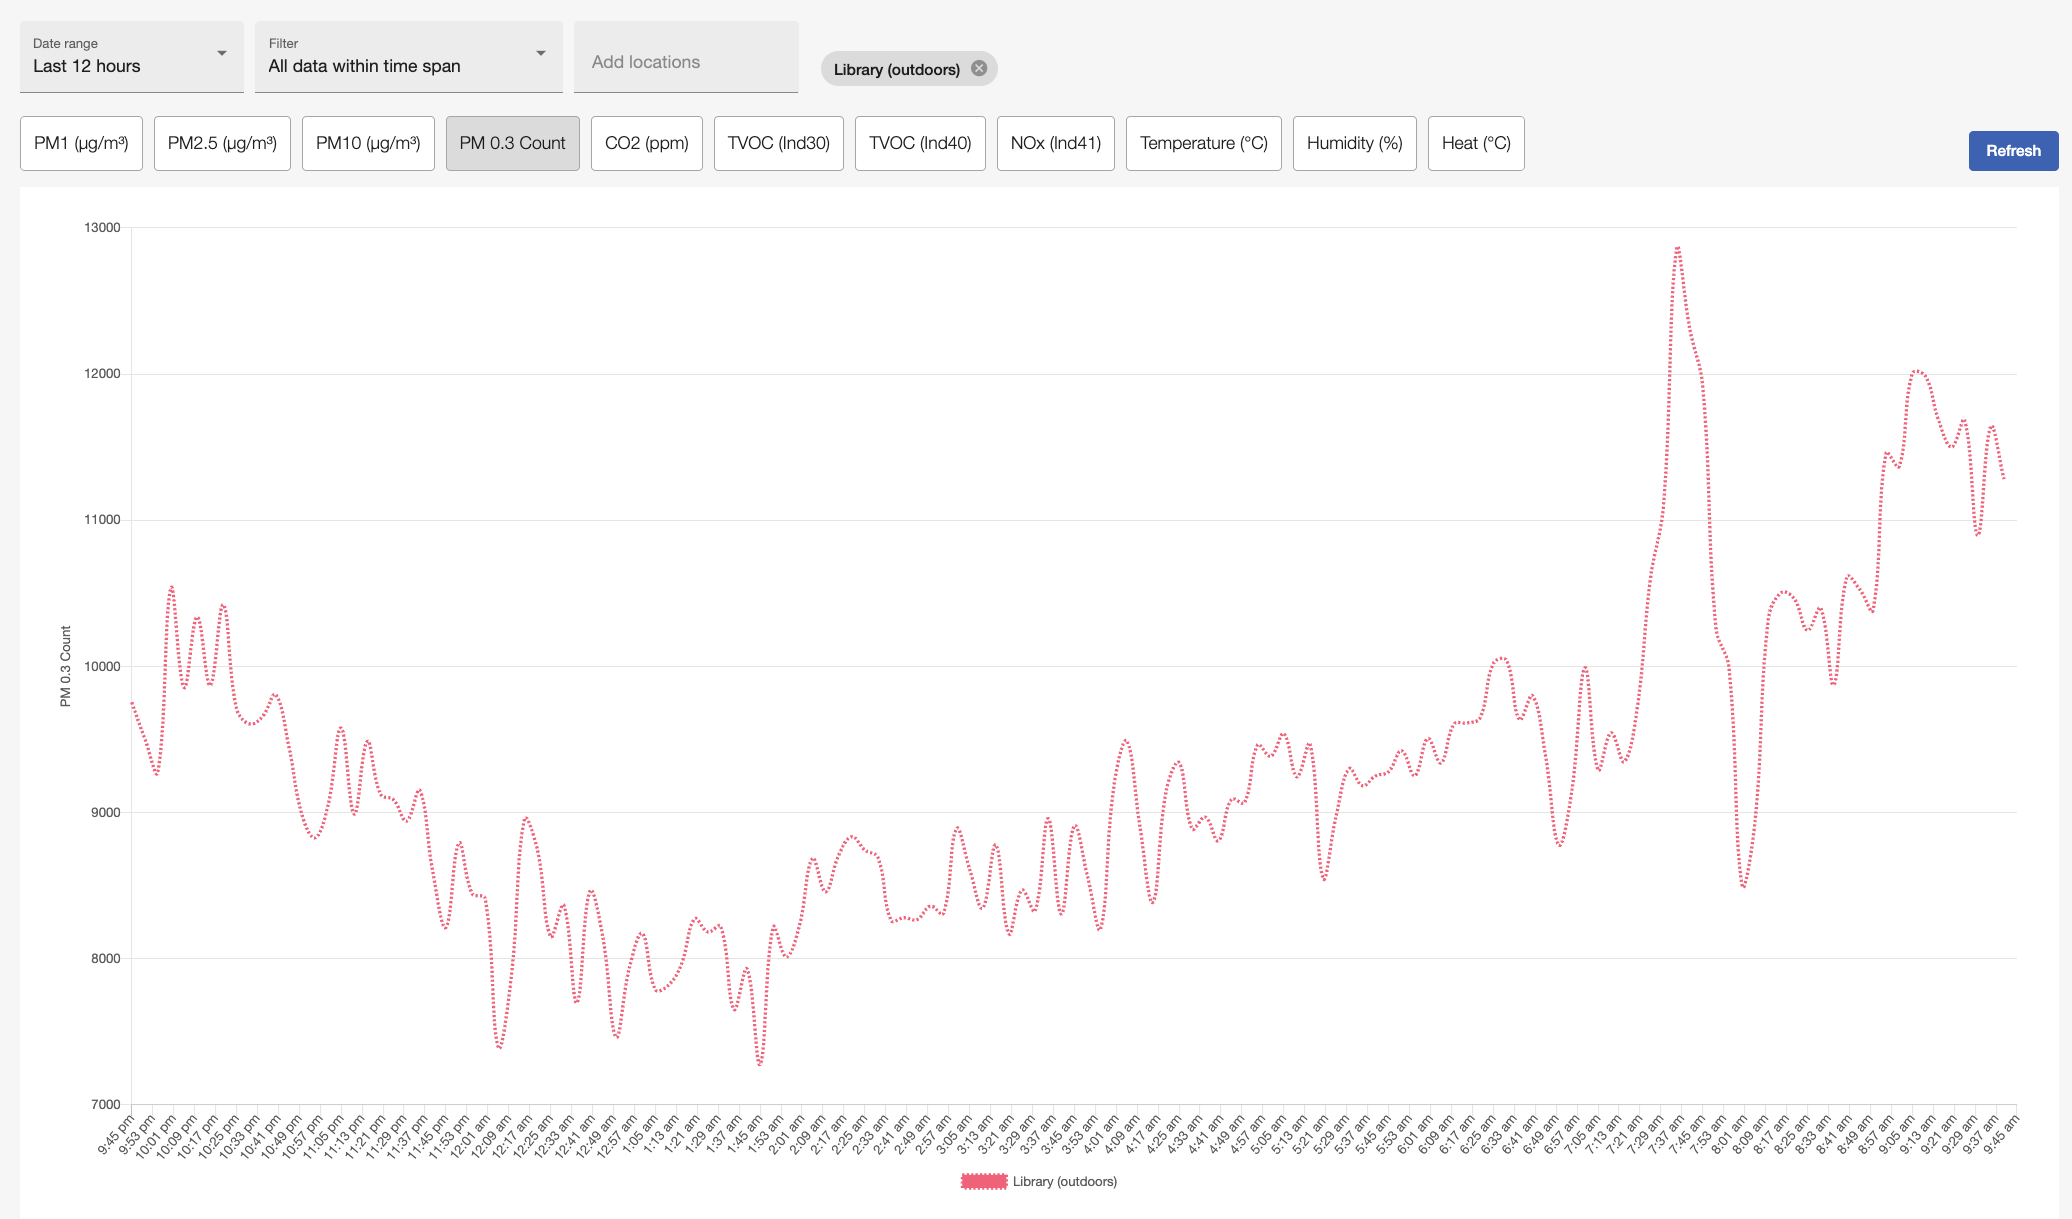
I don’t have any interesting PM 2.5 results, but I am getting interesting and occasionally actionable data from PM 0.3 counts. It is impacted by my use of air filters and is a good indicator of certain actions taken indoors, which cause it to spike, and things like increased ventilation with the outside.
By monitoring it for a day, and modifying how I use my air filters, I was able to move the normal readings in one room from 100+ on average to 30+. That’s neat, even if there isn’t research to back that a lower value is important. Right now in order for me to review what is happening in a reasonable way, I have to look at the raw API response and/or import the data into something else.