(Related reading: Measurement values for the AirGradient One TVOC readings? )
I did an experiment of sorts. I was traveling for ~40 hours and knew that the TVOC 24 hour baseline value of 100 would reset to whatever the background level was. There would be no transient changes from human activity or outdoor air. So, let’s take a look:
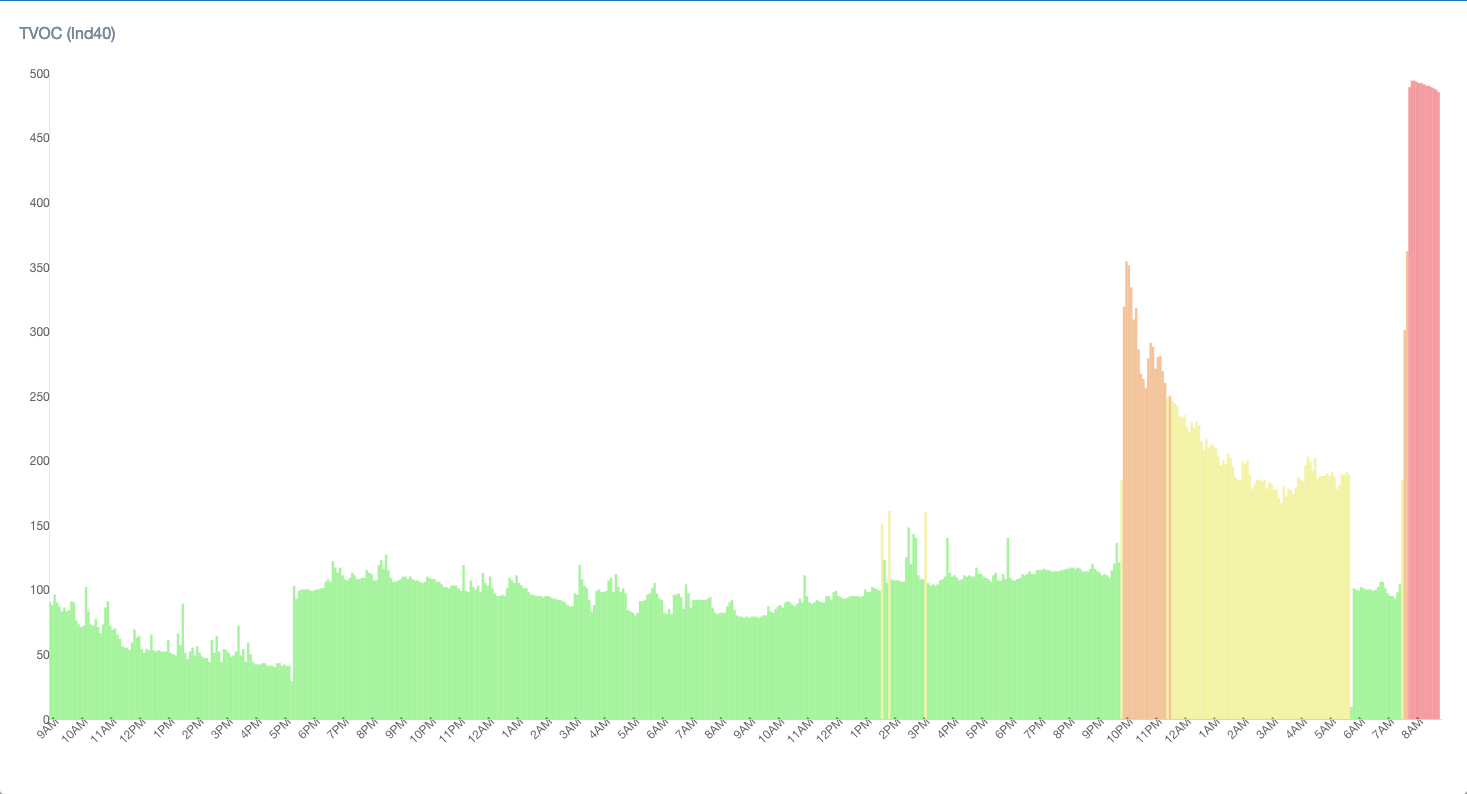
I left at 5 AM, 4 hours before the start of this 48 hour Ind40 chart. The chart gradually trends down at first, which would indicate the air gradually improving. The slower slope in the afternoon may be the 24h average/baseline decreasing, meaning that current readings are less different than the baseline. Absent new VOCs being introduced, one would expect it to converge to 100 after 24 hours.
I don’t know of anything that happened at about 5 PM on day 1. I don’t have an explanation for that increase. I can’t see 1-minute historical readings in the dashboard, but the 5 minute pattern is interesting. The entire increase appears in 1 5-minute data point, but the reading prior to that is significantly lower than any of the prior readings. It goes like this:
17:00: 42 (and for 1+ hour before, every 5 minute avg is 40-45)
17:05: 30 . You can just barely see this as a single chart data point that’s lower than the rest.
17:10: 104 (and stays at 80-120 for 24+ hours after)
This makes me curious whether there might be a short-term sensor resistance change that can manifest this way. Obviously it could very well be a change in the VOC levels, but it’s a little odd that after 12+ hours of expected readings, there’s suddenly the largest drop and then increase. Again, no human activity or air exchange during this time.
That 80-120 range continues through most of day 2. I got home at 9 PM. The increase at 9:45 PM correlates with toasting bread in another room (with some airflow between them) and also with starting to occupy the room with the sensor.
The spike at 7:30 AM (day 3, effectively) also correlates with using the toaster oven.
This is a lot closer to what I want AirGradient to show: changes relative to a known baseline, preferably a stable baseline. As we’ve discussed elsewhere, right now the AG’s baseline isn’t stable… but I was able to partially “fool” it for 24 hours and the data points are a lot more interesting. Although I still don’t know absolute values, at least for the first 12-24 hours after I got back, I know roughly what 100 means: it’s the background level with no human interaction or air.
If I could freeze/calibrate my baseline 100 to that, I would do so. If I could freeze my baseline to outside air (then see how it changes when I move the sensor indoors), I’d do that and be thrilled