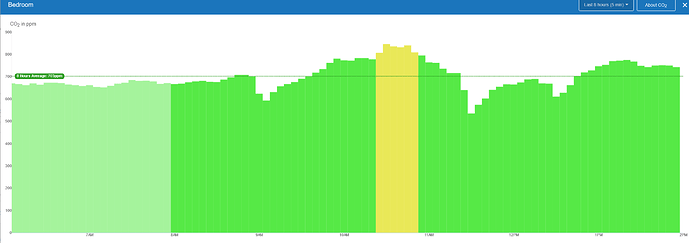
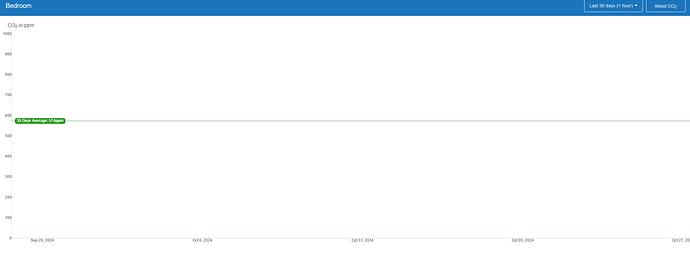
Since today at 4am is the local DST switch from summer to winter time, the 5min resolution plotting which covers the 3-4am Oct. 27th 2024 data will not graph. This applies to all the sensors, im showing only the CO2 for consistensy.
The last 8 hours 5 min graph works since it is 14:07 local time and earliest data point is at 6am.
while the last 24(5min), 48(5min), 1 week(1 hour, 5 min), 30 days(1 hour) will show empty graph.
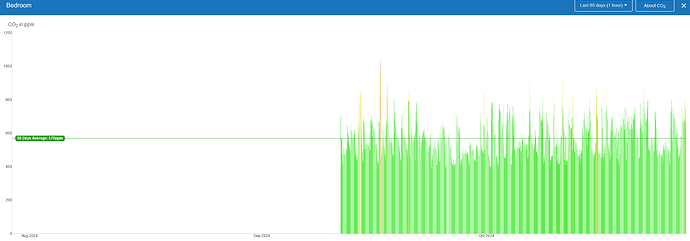
The 30 days(1 day) and 90 days(1 day, 1 hour) will graph
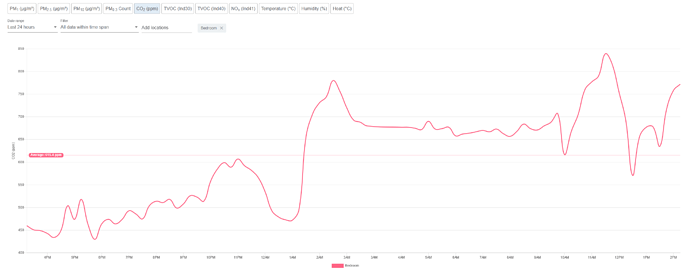
The analytics page will graph the same data without issue.


