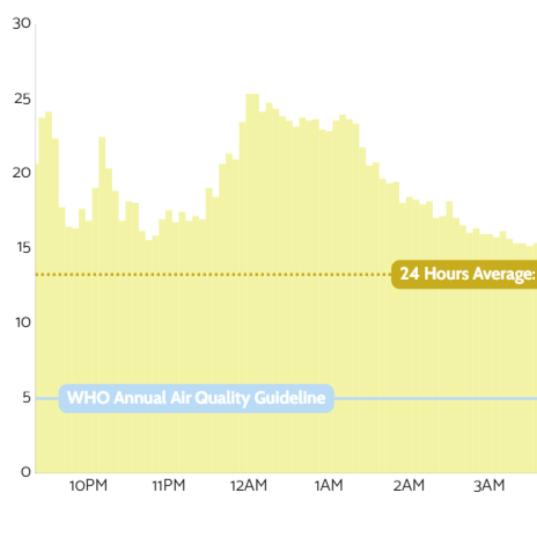
Hi, I noticed that dashboard shows different pm2.5 values compared to the dasboard. Please find the example below for the same time frame.
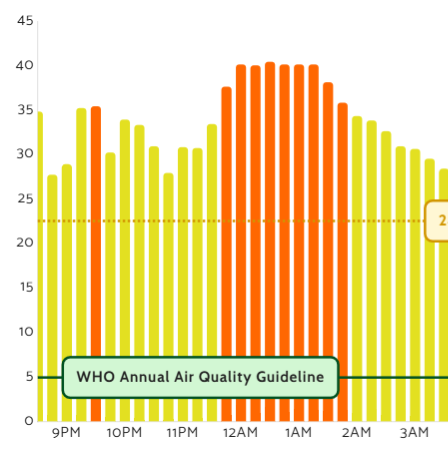
Hi, I noticed that dashboard shows different pm2.5 values compared to the dasboard. Please find the example below for the same time frame.
Yes this is by design.
On the map we apply the standard EPA calibration that was developed for the Plantower PM modules.
On your dashboard you have many more possibilities to set calibration parameters, or just show the raw data. If you set the EPA calibration there, you should see the same values.
Hi @Achim_AirGradient do you need to update your calibration page text, because there it says the map can show both raw and calibrated data, but it seems it’s all calibrated now.
screenshot from: Calibration Algorithms