Air gradient folks: Have you considered allowing users to annotate or comment their data in the dashboard?
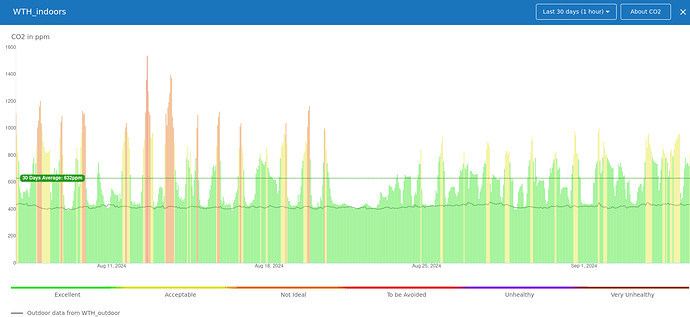
I was looking at my dashboard this evening and stumbled upon an interesting anecdote. Please see below image for our indoor CO2 meter. On the left you see many daily peaks over 1000ppm colored orange. In the middle you can see the indoor CO2 approach outdoor ambient, and on the right you see daily peaks again below 1000ppm. My comment is that the middle low section is consistent with us not being home. We were moving our oldest off to college . The reduction in peak values appears to be from us having one less person in our home, and I just happened to catch that with the chart neatly framed over the last four weeks. I can also explain some recent outdoor and indoor spikes in PM2.5 from us cooking outside with charcoal.
3 Likes
I think this was mentioned in another thread as well, but I fully support being able to add a comment/annotation.
Things such as “lit a candle”, “started cooking”, “opened a window” etc
2 Likes
Indeed, the idea was also suggested here: Manual annotations
Achim mentioned there was a ticket for it, which has recently received higher priority for implementation.
1 Like
Yes I love the idea. We just didn’t come around it but we are just hiring additional developers so hopefully it won’t take too long.
I will bump up the priority.
1 Like
