Thanks to @MallocArray for the code, I’ve been using your airgradient-pro.yaml with my self sourced sensors and it works great. I’ll try out the newest version this weekend.
Home Assistant was new to me when I first started using AirGradient and it was pretty confusing and overwhelming at first (and I come from a technical background). I had an older Raspberry Pi that I used to install HA on using the instructions on the HA site. No problems there.
But after that things got confusing. I found several other sites where I figured out I had to install ESPHome on HA but then spent a lot of time figuring out how to add the device. I ended up understanding I could temporarily plug the AirGradient in via usb into my Pi, go to ESPHome, “New Device”, then “Plug into the computer running ESPHome Dashboard”. BTW, this is just a one time step and after the installation any future configuration updates can be done with the “wirelessly” option.
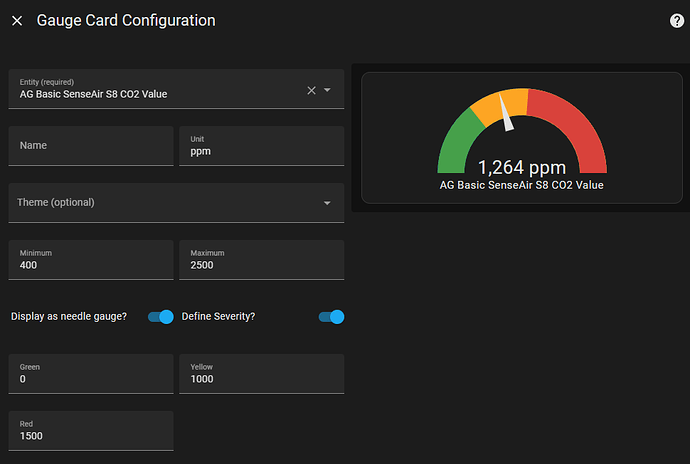
After that appeared successful though I was stuck with @barman’s question of, where’s the data? Again, this was due to having no HA experience. After finally figuring that out and creating some dashboards I feel pretty good about the setup. My one question though, is it possible in HA’s dashboards to color change the state of the graphs depending on thresholds? For example if CO2 > 1000 change it to yellow, like how the AirGradient app is.
I think it would be great to have an integration docs section with screenshots and instructions that live on this site. The forum is great too but I had to search a lot and piece info together as I understood more. Hope that makes sense.

 ?
?