S8 CO2 reading of -1

After building the board, I had several days of operation with correct readings.
3-4 days later, I started to see repeated measurements of -1 and 514 similar to what is reported here.
These readings were consistent for 1-2 days.
I unplugged the micro USB cable, waited 10 seconds, then plugged it in again.
The readings are now in the expected range with no -1 or 514 observed for an hour or so.

I really appreciate the deep debug going on in this thread, I wonder if anyone has a theory what problem could be happening that can be fixed by unplugging the board and replugging?

@mike.bichan If this occurs again, can you also try to change the delay from 100ms to 25ms in airgradient.cpp? See my previous post for the exact line.

After the adjustment, I have now stable readings on 3 airgradient builds for 7 consequent days.

@ttielemans Sure I will do that. It will take a while to understand whether that helps or not though, since just unplugging/replugging it seems to fix it at least temporarily.

i had the -1 every so often. sometimes none at all for a week or more and then a handfull of -1 within one day. decided to give the new air gradient lib a try and used the 25ms suggestion from @ttielemans. it made it a lot worse with 50% of the time it is now -1, 25% it is a number above 65000 and only 25% itā€™s a reasonable number. had it running for 24h. will check with 100ms now

To get this under control is somehow tricky. I did a lot of testing but it is very hard to replicate because of the sporadic nature. Sometimes is seems that increasing the delay helps, sometimes it seems that reducing the delay helps. Still I have the softserial library as prime suspect. I am looking into alternative libraries. I also would like to use the solution developped by @Nimrodus.

The current airgradient lib doesnā€™t check checksum from the S8 sensor. This is what is causing bad readings (most of the time).
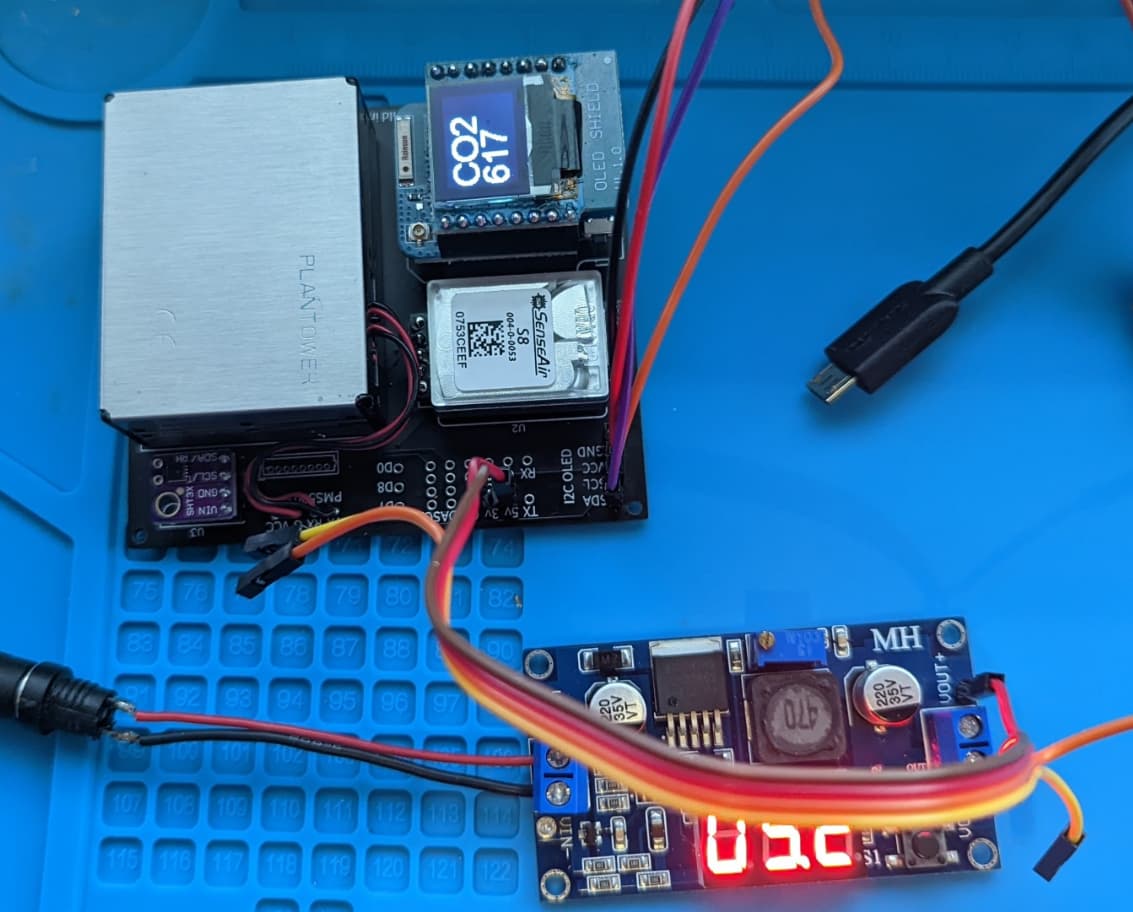
I donā€™t have any more issue with reading CO2 value. Moreover, my fork also put to sleep and wakup the PMS sensor at regular interval to increase its longetivity.

All you need to do to use my code, is install VS Code and Platform.IO and update the src/Configuration/User.cpp file with your own Wifi, etc ā€¦

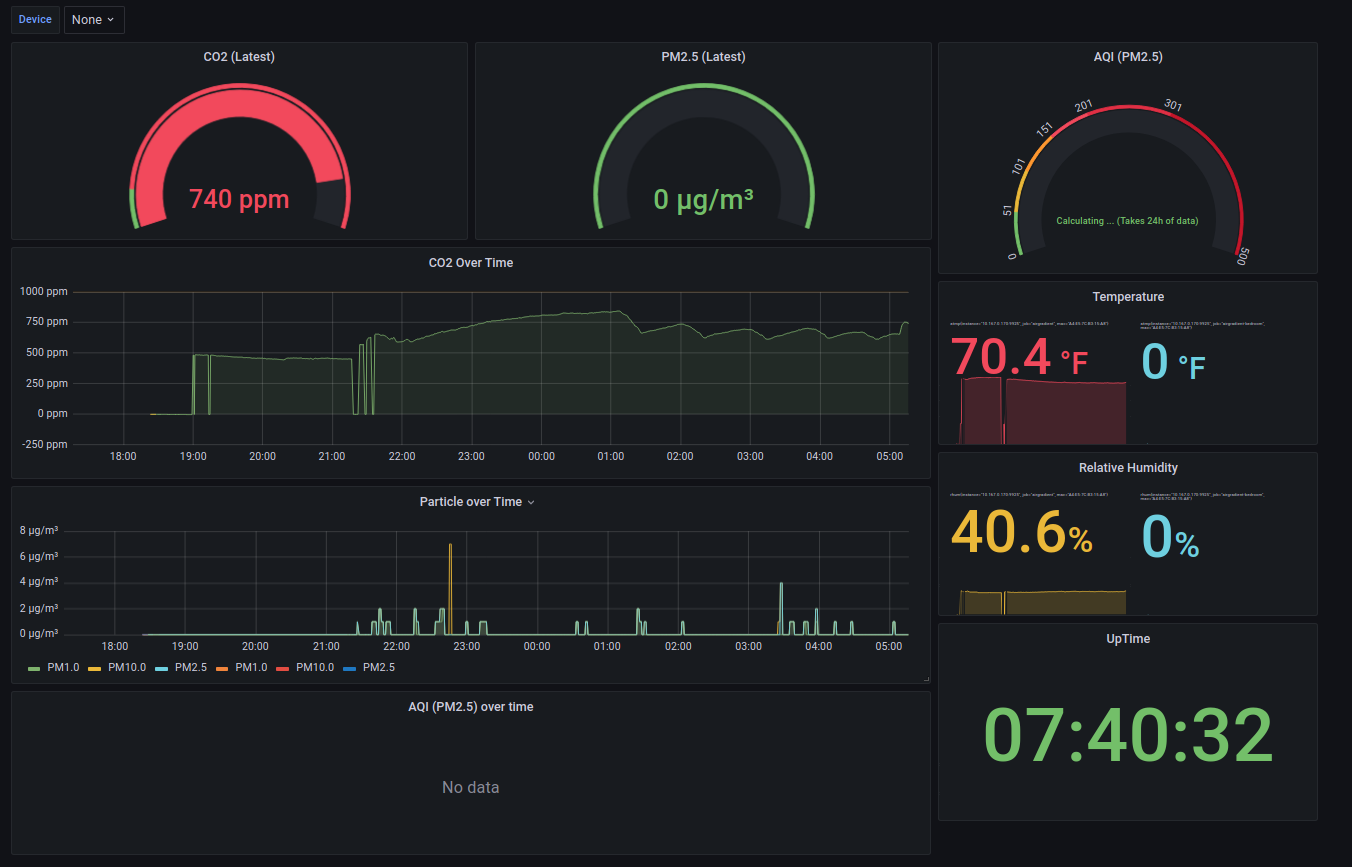
I also posted the updated Dashboard that you can import in Graphana :slight_smile:

Update graph for graphana with a Temperature and Humidity double graph:

{
  "annotations": {
    "list": [
      {
        "builtIn": 1,
        "datasource": "-- Grafana --",
        "enable": true,
        "hide": true,
        "iconColor": "rgba(0, 211, 255, 1)",
        "name": "Annotations & Alerts",
        "target": {
          "limit": 100,
          "matchAny": false,
          "tags": [],
          "type": "dashboard"
        },
        "type": "dashboard"
      }
    ]
  },
  "editable": true,
  "fiscalYearStartMonth": 0,
  "graphTooltip": 0,
  "id": 3,
  "iteration": 1645205891893,
  "links": [],
  "liveNow": false,
  "panels": [
    {
      "datasource": {
        "type": "prometheus",
        "uid": "P1809F7CD0C75ACF3"
      },
      "fieldConfig": {
        "defaults": {
          "color": {
            "mode": "thresholds"
          },
          "mappings": [],
          "thresholds": {
            "mode": "absolute",
            "steps": [
              {
                "color": "green",
                "value": null
              },
              {
                "color": "#EAB839",
                "value": 1000
              },
              {
                "color": "red",
                "value": 2000
              }
            ]
          },
          "unit": "ppm"
        },
        "overrides": []
      },
      "gridPos": {
        "h": 6,
        "w": 6,
        "x": 0,
        "y": 0
      },
      "id": 5,
      "options": {
        "orientation": "auto",
        "reduceOptions": {
          "calcs": [
            "lastNotNull"
          ],
          "fields": "",
          "values": false
        },
        "showThresholdLabels": false,
        "showThresholdMarkers": true,
        "text": {}
      },
      "pluginVersion": "8.4.0",
      "targets": [
        {
          "datasource": {
            "type": "prometheus",
            "uid": "P1809F7CD0C75ACF3"
          },
          "exemplar": true,
          "expr": "rco2{id=\"$DeviceId\"}",
          "interval": "",
          "legendFormat": "",
          "queryType": "randomWalk",
          "refId": "A"
        }
      ],
      "title": "CO2 (Latest)",
      "type": "gauge"
    },
    {
      "datasource": {
        "type": "prometheus",
        "uid": "P1809F7CD0C75ACF3"
      },
      "description": "",
      "fieldConfig": {
        "defaults": {
          "color": {
            "mode": "thresholds"
          },
          "mappings": [],
          "thresholds": {
            "mode": "absolute",
            "steps": [
              {
                "color": "green",
                "value": null
              },
              {
                "color": "#EAB839",
                "value": 10
              },
              {
                "color": "red",
                "value": 20
              }
            ]
          },
          "unit": "conĪ¼gm3"
        },
        "overrides": []
      },
      "gridPos": {
        "h": 6,
        "w": 6,
        "x": 6,
        "y": 0
      },
      "id": 6,
      "options": {
        "orientation": "auto",
        "reduceOptions": {
          "calcs": [
            "lastNotNull"
          ],
          "fields": "",
          "values": false
        },
        "showThresholdLabels": false,
        "showThresholdMarkers": true,
        "text": {}
      },
      "pluginVersion": "8.4.0",
      "targets": [
        {
          "datasource": {
            "type": "prometheus",
            "uid": "P1809F7CD0C75ACF3"
          },
          "exemplar": true,
          "expr": "particle_count{id=\"$DeviceId\", type=\"PM2.5\"}",
          "interval": "",
          "legendFormat": "",
          "queryType": "randomWalk",
          "refId": "A"
        }
      ],
      "title": "PM2.5 (Latest)",
      "type": "gauge"
    },
    {
      "datasource": {
        "type": "prometheus",
        "uid": "P1809F7CD0C75ACF3"
      },
      "fieldConfig": {
        "defaults": {
          "color": {
            "mode": "thresholds"
          },
          "links": [
            {
              "targetBlank": true,
              "title": "AQI Explanation",
              "url": "https://www.airnow.gov/aqi/aqi-basics/"
            }
          ],
          "mappings": [],
          "max": 500,
          "min": 0,
          "noValue": "Calculating ... (Takes 24h of data)",
          "thresholds": {
            "mode": "absolute",
            "steps": [
              {
                "color": "green",
                "value": null
              },
              {
                "color": "#EAB839",
                "value": 51
              },
              {
                "color": "orange",
                "value": 101
              },
              {
                "color": "red",
                "value": 151
              },
              {
                "color": "semi-dark-red",
                "value": 201
              },
              {
                "color": "dark-red",
                "value": 301
              }
            ]
          },
          "unit": "AQI"
        },
        "overrides": []
      },
      "gridPos": {
        "h": 7,
        "w": 5,
        "x": 12,
        "y": 0
      },
      "id": 12,
      "options": {
        "orientation": "auto",
        "reduceOptions": {
          "calcs": [
            "lastNotNull"
          ],
          "fields": "",
          "values": false
        },
        "showThresholdLabels": true,
        "showThresholdMarkers": true
      },
      "pluginVersion": "8.4.0",
      "targets": [
        {
          "datasource": {
            "type": "prometheus",
            "uid": "P1809F7CD0C75ACF3"
          },
          "exemplar": true,
          "expr": "air_quality_index{id=\"$DeviceId\", type=\"PM2.5\"}",
          "interval": "",
          "legendFormat": "",
          "refId": "A"
        }
      ],
      "title": "AQI (PM2.5)",
      "type": "gauge"
    },
    {
      "aliasColors": {},
      "bars": false,
      "dashLength": 10,
      "dashes": false,
      "datasource": {
        "type": "prometheus",
        "uid": "P1809F7CD0C75ACF3"
      },
      "description": "",
      "fieldConfig": {
        "defaults": {
          "unit": "ppm"
        },
        "overrides": []
      },
      "fill": 1,
      "fillGradient": 0,
      "gridPos": {
        "h": 7,
        "w": 12,
        "x": 0,
        "y": 6
      },
      "hiddenSeries": false,
      "id": 2,
      "legend": {
        "alignAsTable": false,
        "avg": false,
        "current": false,
        "max": false,
        "min": false,
        "rightSide": false,
        "show": false,
        "total": false,
        "values": false
      },
      "lines": true,
      "linewidth": 1,
      "nullPointMode": "null",
      "options": {
        "alertThreshold": true
      },
      "percentage": false,
      "pluginVersion": "8.4.0",
      "pointradius": 2,
      "points": false,
      "renderer": "flot",
      "seriesOverrides": [],
      "spaceLength": 10,
      "stack": false,
      "steppedLine": false,
      "targets": [
        {
          "datasource": {
            "type": "prometheus",
            "uid": "P1809F7CD0C75ACF3"
          },
          "exemplar": true,
          "expr": "rco2{id=\"$DeviceId\"}",
          "interval": "",
          "legendFormat": "CO2",
          "queryType": "randomWalk",
          "refId": "A"
        }
      ],
      "thresholds": [
        {
          "$$hashKey": "object:279",
          "colorMode": "warning",
          "fill": true,
          "line": false,
          "op": "gt",
          "value": 1000,
          "yaxis": "left"
        },
        {
          "$$hashKey": "object:285",
          "colorMode": "critical",
          "fill": true,
          "line": false,
          "op": "gt",
          "value": 2000,
          "yaxis": "left"
        }
      ],
      "timeRegions": [],
      "title": "CO2 Over Time",
      "tooltip": {
        "shared": true,
        "sort": 0,
        "value_type": "individual"
      },
      "type": "graph",
      "xaxis": {
        "mode": "time",
        "show": true,
        "values": []
      },
      "yaxes": [
        {
          "$$hashKey": "object:48",
          "format": "ppm",
          "label": "",
          "logBase": 1,
          "show": true
        },
        {
          "$$hashKey": "object:49",
          "format": "short",
          "logBase": 1,
          "show": true
        }
      ],
      "yaxis": {
        "align": false
      }
    },
    {
      "datasource": {
        "type": "prometheus",
        "uid": "P1809F7CD0C75ACF3"
      },
      "description": "",
      "fieldConfig": {
        "defaults": {
          "color": {
            "mode": "thresholds"
          },
          "mappings": [],
          "thresholds": {
            "mode": "absolute",
            "steps": [
              {
                "color": "green",
                "value": null
              },
              {
                "color": "#6ED0E0",
                "value": 0
              },
              {
                "color": "green",
                "value": 18
              },
              {
                "color": "#EAB839",
                "value": 25
              },
              {
                "color": "red",
                "value": 30
              }
            ]
          },
          "unit": "celsius"
        },
        "overrides": []
      },
      "gridPos": {
        "h": 5,
        "w": 5,
        "x": 12,
        "y": 7
      },
      "id": 7,
      "options": {
        "colorMode": "value",
        "graphMode": "area",
        "justifyMode": "auto",
        "orientation": "auto",
        "reduceOptions": {
          "calcs": [
            "lastNotNull"
          ],
          "fields": "",
          "values": false
        },
        "text": {},
        "textMode": "auto"
      },
      "pluginVersion": "8.4.0",
      "targets": [
        {
          "datasource": {
            "type": "prometheus",
            "uid": "P1809F7CD0C75ACF3"
          },
          "exemplar": true,
          "expr": "atmp{id=\"$DeviceId\"}",
          "hide": false,
          "interval": "",
          "legendFormat": "",
          "queryType": "randomWalk",
          "refId": "A"
        }
      ],
      "title": "Temperature",
      "type": "stat"
    },
    {
      "datasource": {
        "type": "prometheus",
        "uid": "P1809F7CD0C75ACF3"
      },
      "description": "",
      "fieldConfig": {
        "defaults": {
          "color": {
            "mode": "thresholds"
          },
          "mappings": [],
          "max": 100,
          "min": 0,
          "thresholds": {
            "mode": "absolute",
            "steps": [
              {
                "color": "green",
                "value": null
              },
              {
                "color": "#6ED0E0",
                "value": 0
              },
              {
                "color": "green",
                "value": 28
              },
              {
                "color": "#EAB839",
                "value": 40
              },
              {
                "color": "red",
                "value": 50
              }
            ]
          },
          "unit": "percent"
        },
        "overrides": []
      },
      "gridPos": {
        "h": 5,
        "w": 5,
        "x": 12,
        "y": 12
      },
      "id": 8,
      "options": {
        "colorMode": "value",
        "graphMode": "area",
        "justifyMode": "auto",
        "orientation": "auto",
        "reduceOptions": {
          "calcs": [
            "lastNotNull"
          ],
          "fields": "",
          "values": false
        },
        "text": {},
        "textMode": "auto"
      },
      "pluginVersion": "8.4.0",
      "targets": [
        {
          "datasource": {
            "type": "prometheus",
            "uid": "P1809F7CD0C75ACF3"
          },
          "exemplar": true,
          "expr": "rhum{id=\"$DeviceId\"}",
          "interval": "",
          "legendFormat": "",
          "queryType": "randomWalk",
          "refId": "A"
        }
      ],
      "title": "Relative Humidity",
      "type": "stat"
    },
    {
      "aliasColors": {},
      "bars": false,
      "dashLength": 10,
      "dashes": false,
      "datasource": {
        "type": "prometheus",
        "uid": "P1809F7CD0C75ACF3"
      },
      "description": "",
      "fill": 1,
      "fillGradient": 0,
      "gridPos": {
        "h": 6,
        "w": 12,
        "x": 0,
        "y": 13
      },
      "hiddenSeries": false,
      "id": 3,
      "legend": {
        "alignAsTable": false,
        "avg": false,
        "current": false,
        "max": false,
        "min": false,
        "rightSide": false,
        "show": true,
        "total": false,
        "values": false
      },
      "lines": true,
      "linewidth": 1,
      "nullPointMode": "null",
      "options": {
        "alertThreshold": true
      },
      "percentage": false,
      "pluginVersion": "8.4.0",
      "pointradius": 2,
      "points": false,
      "renderer": "flot",
      "seriesOverrides": [],
      "spaceLength": 10,
      "stack": false,
      "steppedLine": false,
      "targets": [
        {
          "datasource": {
            "type": "prometheus",
            "uid": "P1809F7CD0C75ACF3"
          },
          "exemplar": true,
          "expr": "particle_count{id=\"$DeviceId\"}",
          "interval": "",
          "legendFormat": "{{type}}",
          "queryType": "randomWalk",
          "refId": "A"
        }
      ],
      "thresholds": [
        {
          "$$hashKey": "object:188",
          "colorMode": "warning",
          "fill": true,
          "line": false,
          "op": "gt",
          "value": 10,
          "yaxis": "left"
        },
        {
          "$$hashKey": "object:194",
          "colorMode": "critical",
          "fill": true,
          "line": false,
          "op": "gt",
          "value": 50,
          "yaxis": "left"
        }
      ],
      "timeRegions": [],
      "title": "Particle over Time",
      "tooltip": {
        "shared": true,
        "sort": 0,
        "value_type": "individual"
      },
      "type": "graph",
      "xaxis": {
        "mode": "time",
        "show": true,
        "values": []
      },
      "yaxes": [
        {
          "$$hashKey": "object:48",
          "format": "conĪ¼gm3",
          "label": "",
          "logBase": 1,
          "show": true
        },
        {
          "$$hashKey": "object:49",
          "format": "short",
          "logBase": 1,
          "show": true
        }
      ],
      "yaxis": {
        "align": false
      }
    },
    {
      "datasource": {
        "type": "prometheus",
        "uid": "P1809F7CD0C75ACF3"
      },
      "fieldConfig": {
        "defaults": {
          "color": {
            "mode": "thresholds"
          },
          "mappings": [],
          "thresholds": {
            "mode": "absolute",
            "steps": [
              {
                "color": "green",
                "value": null
              }
            ]
          },
          "unit": "dtdhms"
        },
        "overrides": []
      },
      "gridPos": {
        "h": 6,
        "w": 5,
        "x": 12,
        "y": 17
      },
      "id": 10,
      "options": {
        "colorMode": "value",
        "graphMode": "area",
        "justifyMode": "auto",
        "orientation": "auto",
        "reduceOptions": {
          "calcs": [
            "lastNotNull"
          ],
          "fields": "",
          "values": false
        },
        "textMode": "auto"
      },
      "pluginVersion": "8.4.0",
      "targets": [
        {
          "datasource": {
            "type": "prometheus",
            "uid": "P1809F7CD0C75ACF3"
          },
          "exemplar": false,
          "expr": "time() - sensors_boot_time{id=\"$DeviceId\"}",
          "instant": true,
          "interval": "",
          "legendFormat": "",
          "refId": "A"
        }
      ],
      "title": "UpTime",
      "type": "stat"
    },
    {
      "datasource": {
        "type": "prometheus",
        "uid": "P1809F7CD0C75ACF3"
      },
      "fieldConfig": {
        "defaults": {
          "color": {
            "mode": "palette-classic"
          },
          "custom": {
            "axisLabel": "",
            "axisPlacement": "auto",
            "barAlignment": 0,
            "drawStyle": "line",
            "fillOpacity": 0,
            "gradientMode": "none",
            "hideFrom": {
              "legend": false,
              "tooltip": false,
              "viz": false
            },
            "lineInterpolation": "linear",
            "lineWidth": 1,
            "pointSize": 5,
            "scaleDistribution": {
              "type": "linear"
            },
            "showPoints": "auto",
            "spanNulls": false,
            "stacking": {
              "group": "A",
              "mode": "none"
            },
            "thresholdsStyle": {
              "mode": "off"
            }
          },
          "mappings": [],
          "thresholds": {
            "mode": "absolute",
            "steps": [
              {
                "color": "green",
                "value": null
              },
              {
                "color": "red",
                "value": 60
              }
            ]
          },
          "unit": "humidity"
        },
        "overrides": [
          {
            "matcher": {
              "id": "byName",
              "options": "Temp"
            },
            "properties": [
              {
                "id": "custom.axisPlacement",
                "value": "right"
              },
              {
                "id": "unit",
                "value": "celsius"
              }
            ]
          }
        ]
      },
      "gridPos": {
        "h": 8,
        "w": 12,
        "x": 0,
        "y": 19
      },
      "id": 16,
      "options": {
        "legend": {
          "calcs": [],
          "displayMode": "list",
          "placement": "bottom"
        },
        "tooltip": {
          "mode": "multi",
          "sort": "none"
        }
      },
      "targets": [
        {
          "datasource": {
            "type": "prometheus",
            "uid": "P1809F7CD0C75ACF3"
          },
          "exemplar": true,
          "expr": "rhum{id=\"$DeviceId\"}",
          "interval": "",
          "legendFormat": "Humidity",
          "refId": "A"
        },
        {
          "datasource": {
            "type": "prometheus",
            "uid": "P1809F7CD0C75ACF3"
          },
          "exemplar": true,
          "expr": "atmp{id=\"$DeviceId\"}",
          "format": "time_series",
          "hide": false,
          "interval": "",
          "legendFormat": "Temp",
          "refId": "B"
        }
      ],
      "title": "Humidity & Temperature",
      "type": "timeseries"
    },
    {
      "datasource": {
        "type": "prometheus",
        "uid": "P1809F7CD0C75ACF3"
      },
      "fieldConfig": {
        "defaults": {
          "color": {
            "mode": "palette-classic"
          },
          "custom": {
            "axisLabel": "",
            "axisPlacement": "auto",
            "barAlignment": 0,
            "drawStyle": "line",
            "fillOpacity": 0,
            "gradientMode": "none",
            "hideFrom": {
              "legend": false,
              "tooltip": false,
              "viz": false
            },
            "lineInterpolation": "linear",
            "lineWidth": 1,
            "pointSize": 5,
            "scaleDistribution": {
              "type": "linear"
            },
            "showPoints": "auto",
            "spanNulls": false,
            "stacking": {
              "group": "A",
              "mode": "none"
            },
            "thresholdsStyle": {
              "mode": "off"
            }
          },
          "mappings": [],
          "thresholds": {
            "mode": "absolute",
            "steps": [
              {
                "color": "green",
                "value": null
              },
              {
                "color": "red",
                "value": 80
              }
            ]
          }
        },
        "overrides": []
      },
      "gridPos": {
        "h": 5,
        "w": 12,
        "x": 0,
        "y": 27
      },
      "id": 14,
      "options": {
        "legend": {
          "calcs": [],
          "displayMode": "list",
          "placement": "bottom"
        },
        "tooltip": {
          "mode": "single",
          "sort": "none"
        }
      },
      "targets": [
        {
          "datasource": {
            "type": "prometheus",
            "uid": "P1809F7CD0C75ACF3"
          },
          "exemplar": true,
          "expr": "air_quality_index{id=\"$DeviceId\", type=\"PM2.5\"}",
          "interval": "",
          "legendFormat": "AQI",
          "refId": "A"
        }
      ],
      "title": "AQI (PM2.5) over time",
      "type": "timeseries"
    }
  ],
  "refresh": "1m",
  "schemaVersion": 35,
  "style": "dark",
  "tags": [],
  "templating": {
    "list": [
      {
        "current": {
          "selected": false,
          "text": "livingroom",
          "value": "livingroom"
        },
        "datasource": {
          "type": "prometheus",
          "uid": "P1809F7CD0C75ACF3"
        },
        "definition": "label_values(rco2, id)",
        "hide": 0,
        "includeAll": false,
        "label": "Device",
        "multi": false,
        "name": "DeviceId",
        "options": [],
        "query": {
          "query": "label_values(rco2, id)",
          "refId": "StandardVariableQuery"
        },
        "refresh": 1,
        "regex": "",
        "skipUrlSync": false,
        "sort": 1,
        "type": "query"
      }
    ]
  },
  "time": {
    "from": "now-12h",
    "to": "now"
  },
  "timepicker": {},
  "timezone": "",
  "title": "AirGradient Uptime",
  "uid": "Tvl1xTmRz",
  "version": 14,
  "weekStart": ""
}

@ttielemans

1 Like

the new lib version with 100ms delay worked for me. for a few days. and then i got -1 again. interestingly, always with around an hour between the -1 readings. for now restarting solves the issue.

looked at the code from @Nimrodus, who is using another lib for the co2 sensor. seems that this lib is doing a few things a bit different. once i find some free time (as if that would happen anytime soon :smiley: ) iā€™ll modify the airgradient lib to follow the same approach.

I actually already have a full rewrite of the AirGradient lib that weā€™re checking with @Achim_AirGradient :slight_smile: that will use proper dependencies on different libs.

I just installed the version you have on github. Its been running about 20 minutes with no data at all from the sensors.

# HELP particle_count Count of Particulate Matter in ƂĀµg/m3
# TYPE particle_count gauge
particle_count{id="",mac="A4:E5:7C:B3:XX:XX",type="PM2.5"}0
# HELP particle_count Count of Particulate Matter in ƂĀµg/m3
# TYPE particle_count gauge
particle_count{id="",mac="A4:E5:7C:B3:XX:XX",type="PM1.0"}0
# HELP particle_count Count of Particulate Matter in ƂĀµg/m3
# TYPE particle_count gauge
particle_count{id="",mac="A4:E5:7C:B3:XX:XX",type="PM10.0"}0
# HELP rco2 CO2 value, in ppm
# TYPE rco2 gauge
rco2{id="",mac="A4:E5:7C:XX:XX"}0
# HELP atmp Temperature, in degrees Celsius
# TYPE atmp gauge
atmp{id="",mac="A4:E5:7C:B3:XX:XX"}0.00
# HELP rhum Relative humidity, in percent
# TYPE rhum gauge
rhum{id="",mac="A4:E5:7C:B3:XX:XX"}0.00
# HELP sensors_boot_time AirGradient_Internal boot time, in unixtime.
# TYPE sensors_boot_time gauge
sensors_boot_time{id="",mac="A4:E5:7C:B3:XX:XX"}0

I uploaded Jeffs original sketch and it works, however, still have the issue with the -1 on the CO

I only encountered this issue once.
Can you simply restart the board if it happens again ?

I have reset, pulled the USB several times, still getting no data on either the display or the prometheus end point.

just zeros.

It seems that if I hold open the serial port on the ESP, by keeping serial monitor on in Arduino IDE, it displays data, as soon as I close serial monitor, I lose data display

Do you see anything weird in the Serial Monitoring ?

This could be a symptom that one of the sensor couldnā€™t initialize correctly

Not reallyā€¦

>>> SenseAir S8 NDIR CO2 sensor <<<
Firmware version: 1.92
Sensor type: 0x00010E
ABC period: 180
Transmit NTP Request
pool.ntp.org: 72.30.35.88
Epoch: 1645670157
HTTP server started at ip
Record PM2.5 (1) for AVG: (1.000000
)Record PM2.5 (0) for AVG: (0.500000)
Record PM2.5 (0) for AVG: (0.333333)
Couldn't get proper CO2 reading

Display shows AQI - NA and PM2 - 0, so I believe it may be having issues with the PM sensorā€¦

Something else of note, it doesnā€™t seem bothered by which serial port the monitor is connected to to.

Currently I have the airgradient on /dev/ttyUSB7 and another esp32 on /dev/ttyUSB10 (doing a temp comparison test) and the airgradient board is happily spitting out CO2 dataā€¦ if I shut down that esp32 it stopsā€¦

I wonder if itā€™s a Power issue.

The board donā€™t like when there is fluctuation of power. In my case, itā€™s currently plugged into a USB powerhub to avoid any issue.

I have an adjustable buck converter I am going to tryā€¦ Iā€™ll let you know what I see with that.

I think you are on to somethingā€¦

Iā€™m pretty confident that our issues with this sensor are not power, but ground plane issues.

I took a look at the board on EasyEDA and itā€™s designed as a 2 layer board and both layers have traces going everywhere and no ground pours.

Thereā€™s nothing there to reduce EMF. Iā€™m redesigning the board in Kicad to try to move as many traces to the front and create a solid ground pour on the back side. I just need to add the graphics and itā€™s good to go.

I did quite some analysis of this issue. What I see happening is a serial communication problem. Various sources in other projects are mentioning that the Softserial library has some (timing) issue. I did not have the time to try them yet but it confirms softserial as potential source for errors.

I have been running my sensor connected to my development pc for a long time. It shows the output of the 8 values of CO2Response[i] . In case of a correct reading CO2Response[0] should contain 0xFE. I observed that this value is sometimes shifted to CO2Response[1] and leads to an incorrect value. I have adopted the function AirGradient::getCO2_Raw() in airgradient.cpp and work around this problem. Maybe not the most structural solution but it works.

I am running 3 sensors since 19/02 and did not see any false reading until today.

int AirGradient::getCO2_Raw(){
	const byte CO2Command[] = {0xFE, 0X44, 0X00, 0X08, 0X02, 0X9F, 0X25};
	byte CO2Response[] = {0,0,0,0,0,0,0};
	int datapos = -1;
	
	while (datapos == -1) {
		_SoftSerial_CO2->write(CO2Command, 7);
		delay(100);
		int bytesinbuffer = _SoftSerial_CO2->available();
		
		for (int i=0; i < bytesinbuffer; i++) {
			delay(25);
			CO2Response[i] = _SoftSerial_CO2->read();
			// yield();
			if ((CO2Response[i] == 0xFE) && (datapos == -1)){
				datapos = i;
			}
			Serial.print (CO2Response[i],HEX);
			Serial.print (":");
		}
  }	
  
  unsigned long val = CO2Response[datapos + 3]*256 + CO2Response[datapos + 4];  
  Serial.println (val);
  return val;	
}
1 Like

I have 5 of these on the way, if anyone is interested in one, Iā€™ll have 3 extra. PM me and Iā€™ll send you one when they arrive.