That is the Arduino based one direct from AirGradient
1 Like
Good to know - thank you! I will await that updated firmware so I can try calibrating it, but also compare to the other brand of CO2 monitor that I ordered.
For what it’s worth, I’m now running a 3D printer for a styrene-based print next to my sensor and the TVOC levels are happily staying around 50. They don’t seem to be responding to 1 hour of styrene gas being emitted… 30 cm away from the sensor.
1 Like
You are printing ABS?
I haven’t seen considerable increases while I’m 3d printing, but I’m mostly using PLA. Just about ready to do some ABS though
ASA, but similar family.
@ichiban @MallocArray @William @troy
I just wrote a detailed blog post about TVOCs and our opinion on how it should be used.
TVOC - When it's useful and when it's useless
I hope that this explains some of the issues raised here.
I also added more infomation on our product pages explaining and linking to the Sensirion VOC index.
Happy to discuss it more here in case there are any questions or thoughts. One of the reasons we want to discuss this topic in one of our planned webinar is just the complexity of it.
4 Likes
Thanks for thinking through this, @Achim_AirGradient. The 2 examples in your new blog post are the types of things that I’d like to use my AirGradient for, but I don’t understand how the AirGradient/SGP-41 readings would allow for those examples. Can you edit the blog post to add some detail? Here’s the specifics I’d like to understand:
-
In the art class example, if someone opened a can of paint and the TVOC reading spiked, the reading would only spike until those new VOCs got incorporated into the rolling 24 hour baseline. That is, it might jump from 125 to 400 (just examples), but over the next 24 hours, the readings would drop back down to 100 as the rolling 24 hour baseline gradually increased. How would they know that the paint can (or any other source) is still affecting the air?
This is the best example of what I’d like to use AG for, but I don’t understand how relative readings against a short-duration rolling baseline (24 hours) could “[show] high VOC levels that stayed up for quite some time”. If the VOC levels stay up for more than a few hours, the baseline (100) value will start to factor that in. If the VOCs in the air stay constant (ie, a paint can that is open), then the meaning of 100 will gradually rise until it’s the same as the current readings; given constant VOCs, it seems impossible for the readings to stay elevated for long enough to identify an issue like this.
(This wouldn’t be true if the rolling baseline was the average over a far longer duration, such as a month, or if the baseline wasn’t rolling and was only updated when the user requested it.)
I hope I’m explaining this clearly. There may well be some part of the Sensiron’s or AirGradient’s implementation that I don’t understand, if so, and that’s what I think should be added to the blog.
-
In the office building example where “the VOC levels increased dramatically,” can you add some guidance about what readings users should consider “dramatic” and how you arrived at that guidance? Like if a reading jumps from 75 to 400, how do they know that’s a dramatic increase? I assume it’s big in relative terms, but how would they know it’s big in absolute terms (or whatever you consider worth investigating)?
I like your constraint that “to only put sensor modules into the AirGradient where we can clearly know what causes the measurements and clear actions can be derived from the values.” In that example, can you add some guidance how to know whether 400 (or 300 or 495 or…) is a big enough increase to warrant investigation? (I’m just talking about quantity here, not the specific compound. Obviously these are total VOC sensors, so they can’t say whether the specific compound is actually a health problem. That is up to the user. I’m just wondering how this office example would know when they should investigate.)
-
What is the scale? I mean that in 3 ways:
-
Is the range from 100-500 linear, logarithmic, or something else?
-
Same question for the range from 0-100, and is 0 really 0 in absolute terms too?
-
@William reported readings in the 700+ range (ie, outside of 0-500). Is that possible, and if so, what is the range of possible values?
Last but not least, thank you! You’re solving an important problem and these are complicated topics. I appreciate that you’re taking the time to think through them and help users do the same.
3 Likes
This may be that a styrene print doesn’t produce any VOCs that the SGP41 detects. Your experience made me curious, so I Googled does sgp41 detect styrene (not exactly the most optimized query, sorry!  ) and landed here: Evaluating a Novel Gas Sensor for Ambient Monitoring in Automated Life Science Laboratories - PMC
I haven’t read it all yet, but:
The SGP41 sensor was tested with 10 different VOC solvents, namely acetone, acetonitrile, benzene, diethyl ether, ethanol, formic acid, hexane, isopropanol, methanol, and toluene.
…
The VOC-Index (SGP41 sensor) and IAQ-Index (BME688 sensor) testing revealed that both sensors have a good response to all tested solvent volumes.
Styrene gas is not among the compounds mentioned. That said, Emission Profiles of Volatiles during 3D Printing with ABS, ASA, Nylon, and PETG Polymer Filaments - PMC has a chart of emissions observed during ASA FFF printing. Find in the document for “Temperature-dependent emission profile of the ASA filament”. They did detect some toluene and
benzene, especially at >240 C.
Here’s one idea: use a long enough power cord to put it outside or in a window for 24 hours (assuming your outdoor air is clean). As I understand it, that would reset the baseline 100 reading to be the reading for outdoor air - hopefully quite low. Then, without unplugging it, set it near the 3D printer and do the same type of print. If it registers this time, maybe your indoor air has enough VOCs present that a print doesn’t increase it enough to register. I have no clue here, I’m just guessing 
1 Like
In case it helps, I am attaching a screenshot of the dashboard showing the high TVOC reading yesterday - and you can see there was a second spike over 500 this morning as well.
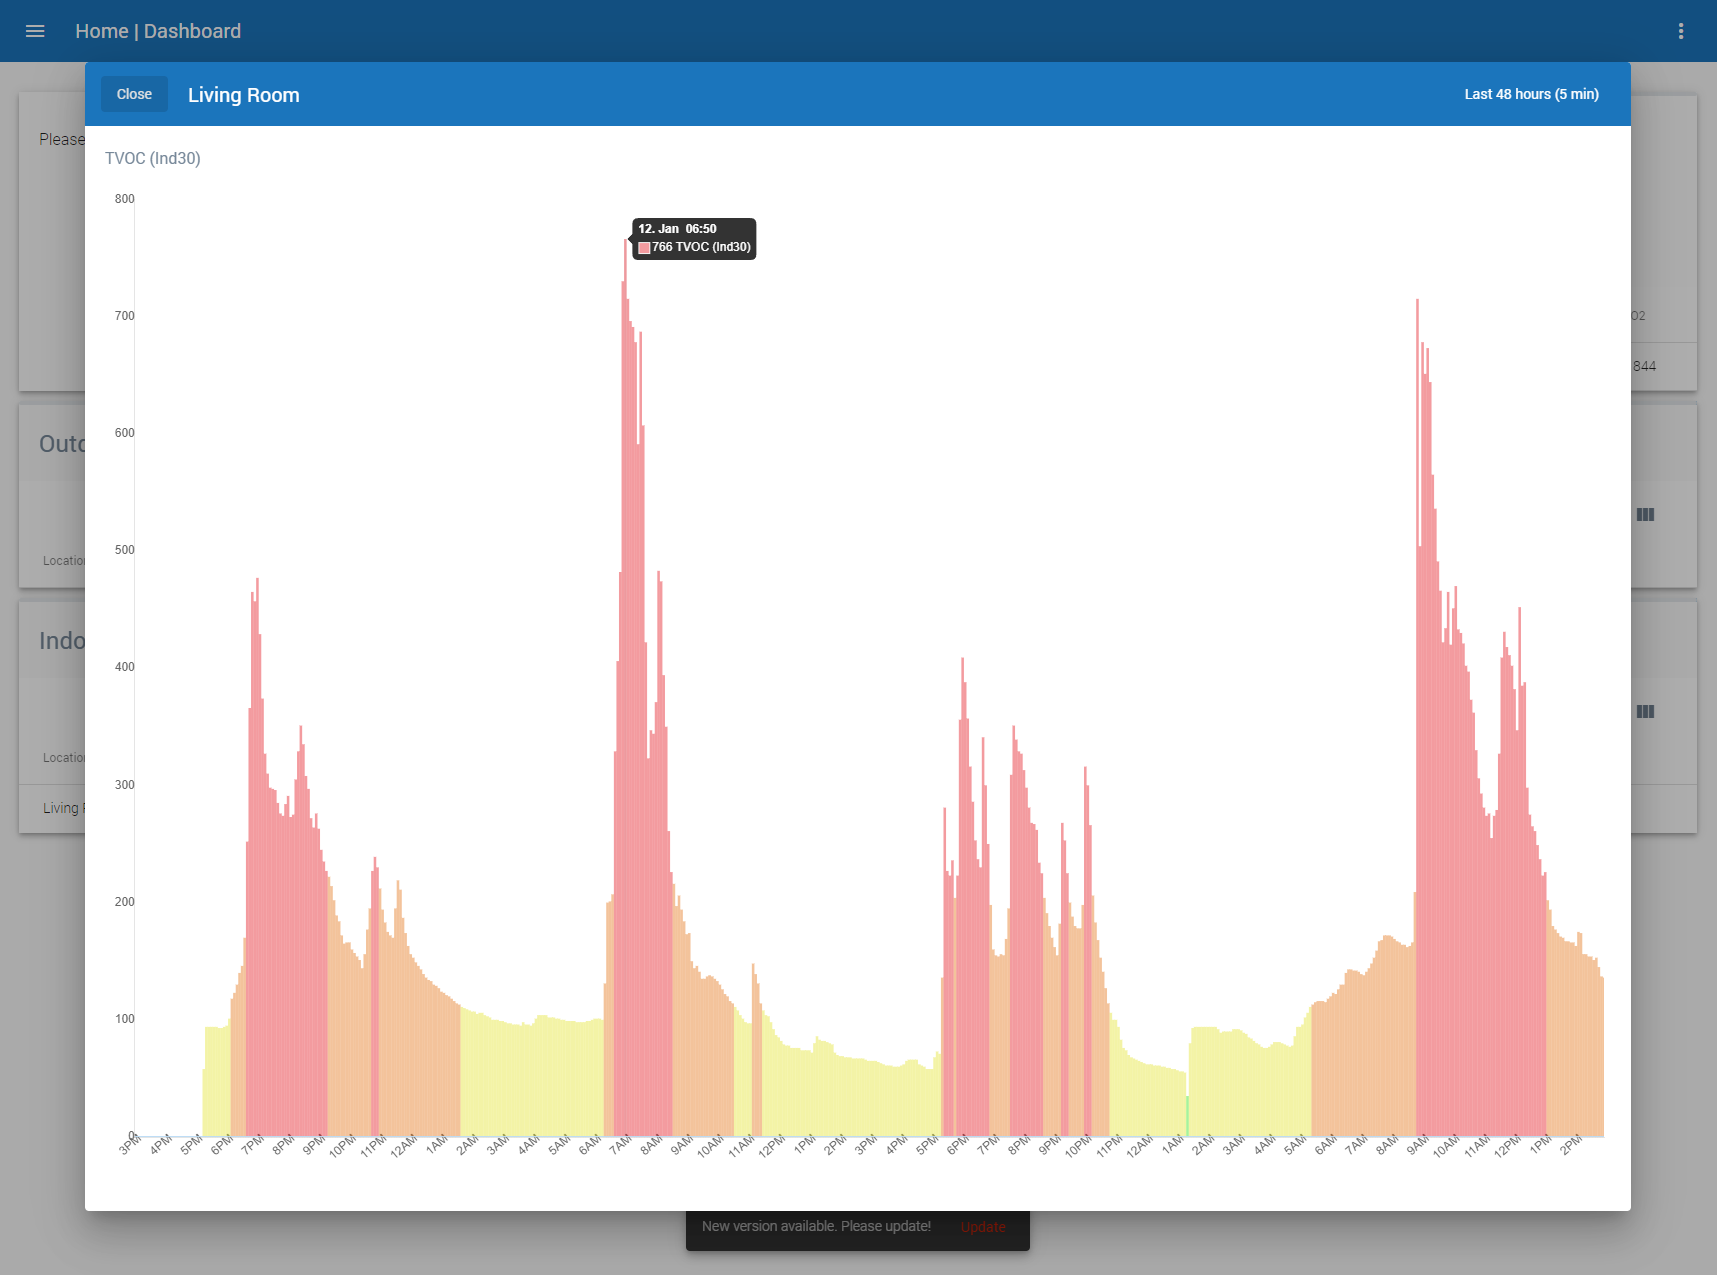
You need to look at the ind40 column which will represent the SGP41 voc Index and max out at 500.
(The ind30 is a conversion we do for some building standards. In my opinion not very useful but some customers need it.)
@troy I contacted Sensirion about this and will add some more details into the blog post once I hear back from them.
2 Likes
I was similarly confused as Troy about the point of relative TVOC values. I’ve looked at the spec sheet for the SGP41 sensor.
The sensor does give you absolute values. After measuring the raw values, you are supposed to use them as input to their index algorithm, which calculates the relative value.
The raw signals in ticks are proportional each to the logarithm of the corresponding sensor resistance. These tow signals are used as input for Sensirion’s Gas Index Algorithm to provide processed VOC and NOx Indices.
I expect this algorithm is computed in Airgradient’s firmware. I haven’t checked the code to verify this yet.
In my opinion this is wrong. I want to see the absolute raw values directly. You can always go from absolute values back to relative values, but you cannot do it the other way around. For all the measurements that the monitor shows, I have an estimate in my head about what a normal value is, which allows me to recognize shifts. And if I can’t do this intuitively, then it is obvious from graphing the change over time. But using a relative value only as is the case right now for TVOC is wrong.
Imagine I introduce a constant TVOC pollutant in my home. The measurement would initially spike but then gradually go back to the neutral 100, as the algorithm learns over 24 hours that this is a normal value. I would then think that my TVOC pollutant has disappeared when in fact it is still there.
3 Likes
We use the official Sensirion library in our fw code that calculates the index.
This is the recommended application of the sensor by Sensirion.
However, I will also discuss with them to what extent the raw value makes sense. It might then be something that we can report in parallel.
I will update here once I hear back.
2 Likes
I’m glad you’re checking. For now while you’re figuring this out, what do you think about un-publishing the blog post?
IMO, someone who reads that blog post is actually more likely to think AirGradient’s sensor can do things it can’t do[1], because the 2 examples are at best optimistic and at worst, not currently possible. They aren’t representative of what’s actually realistic, yet if someone reads them, they’ll think “Yeah, cool, these examples are what I’m trying to do.”
Also, a reader would leave without understanding the two big weaknesses that were surprises to folks in this thread. It explains other weaknesses of MOX sensors (that they detect some harmless compounds too and can’t tell the difference), but I think should include something like this, near the top where it’s impossible to miss:
What can’t the TVOC sensor tell you?
The size of a VOC change (big vs. small increase/decrease). All measurements use relative values. The values are relative to the average over the past 24 hours, but that average is not available in absolute terms. As a result, there is no way to tell whether an increase or decrease that seems big in relative terms is actually large in absolute terms.
Whether or not a change in VOC content is still present. VOC measurements are relative to the VOC content over the past 24 hours. If VOCs in the air increase, values will go up. However, in the subsequent 24 hours following the increase or decrease, the new VOCs will gradually be incorporated into the the baseline. After 24 hours, they will be part of the baseline, so there is no way to tell whether they are still present.
… possibly with a link to this forum thread for readers who want to learn more.
If you would prefer to leave the blog post up, maybe add that near the top.
[1]: Based on the information in this thread. If someone disagrees, feel free to refute what’s been written.
While I don’t fully understand their code and what it is doing, I do know that raw values are not necessarily the same as absolute values of TVOC concentrations. I assume they are exactly what they say, raw measurements from the sensor in regards to change in resistance that are then used to determine the index.
It would be interesting to make up some code to get it to display just the raw value and see what they look like, but nothing I’m planning on doing anytime soon.
As your quote from the spec sheet states, they are related to the resistance and are used to determine the index value, which is what this sensor is intended to output.
I wouldn’t be in favor of unpublishing the blog post as I don’t see the problem with it. (Note, I’m not part of the official AirGradient team)
Sure, there is some nuance that isn’t included in it, but it also isn’t a spec sheet that explains every facet.
If I’m painting a room and see the VOC index spike, I can ventilate the room until I see it go down, which I can do in less than 24 hours. If I’m cooking and see a huge spike, I see it correlate with PM2.5 increases and ventilate until both are reduced.
I know a user posted here in the forum that showed spikes multiple times a day that ended up being hand sanitizer use, and maybe they be more aware of where and how they are using it, or choose to get a different product.
So it does provide value, but I also see my numbers fluctuate 50-175 pretty regularly that I can’t account for, so I take all of it with a grain of salt, which is also mentioned in the blog post about not being able to determine between harmless and bad VOCs
Oh, thank you! I hadn’t even realized there were additional sensor columns available in the dashboard - now I’ve turned them all on
The highest ind40 measurement I see is 489 at 11am this morning (so within the 1-500 scale, as expected) - which incidentally corresponds with a peak of 1419 on ind30.
I will continue to watch this discussion as it is very interesting! Thank you all again.
I agree I think there is a lot of information in there that is good to know now even we are in the process to investigate this further. But I will add a link to this discussion so that people who want more context or have questions are directed to here.
I looked again at the ESPHome options for the SGP4x sensor, and I’m not sure if they were recently added, or I just wasn’t paying attention, but there are a whole host of options to tweak the learning offset hours, gain hours, index offset, etc. So with that firmware there is the option to tweak the defaults.
SGP40 Volatile Organic Compound Sensor and SGP41 VOC and NOx Sensor — ESPHome
1 Like
I am in touch with Sensirion and they asked me to send them the questions we have.
Mine are:
- What exactly is the SVOC_RAW signal. How can this be used an an absolute indication of the VOC amount?
- What is the typical drift of the raw signal out of the box?
- Is the raw signal humidity and temperature compensated?
- How to use the VOC index to detect longer term higher VOC concentrations?
Please let me know questions you might have and I can also address it.
1 Like