We are not aware of a current server issue. Please contact our support with the serial number of your monitor.
1 Like
When I remove the sensors from home assistant rebooting stops. I thought this sensor has native support within Home assistant. That’s the main reason I bought these.
After removing and waited 30 minutes I added the sensors to HA, after some minutes rebooting starts again.
What can I do?
Also today same performance… whole night, morning and until end of afternoon sensor is stable. After 5pm (NL time) the sensor is complaining again about server n/a.
During reboot/server unavailability I receive also a weird temp value.
I will do some more tests, because sometime I become crazy.  it looks like the airco standing 3 meters away is influencing system connections??? Not sure but at night no airco on, morning no airco…. Somewhere this afternoon I turned on the airco and there it is…. But more logic is the connection with HomeAssistant is causing this issue. This afternoon the boot count was also reset.
Disabled the sensors in HA this afternoon again. Let’s see where it goes.
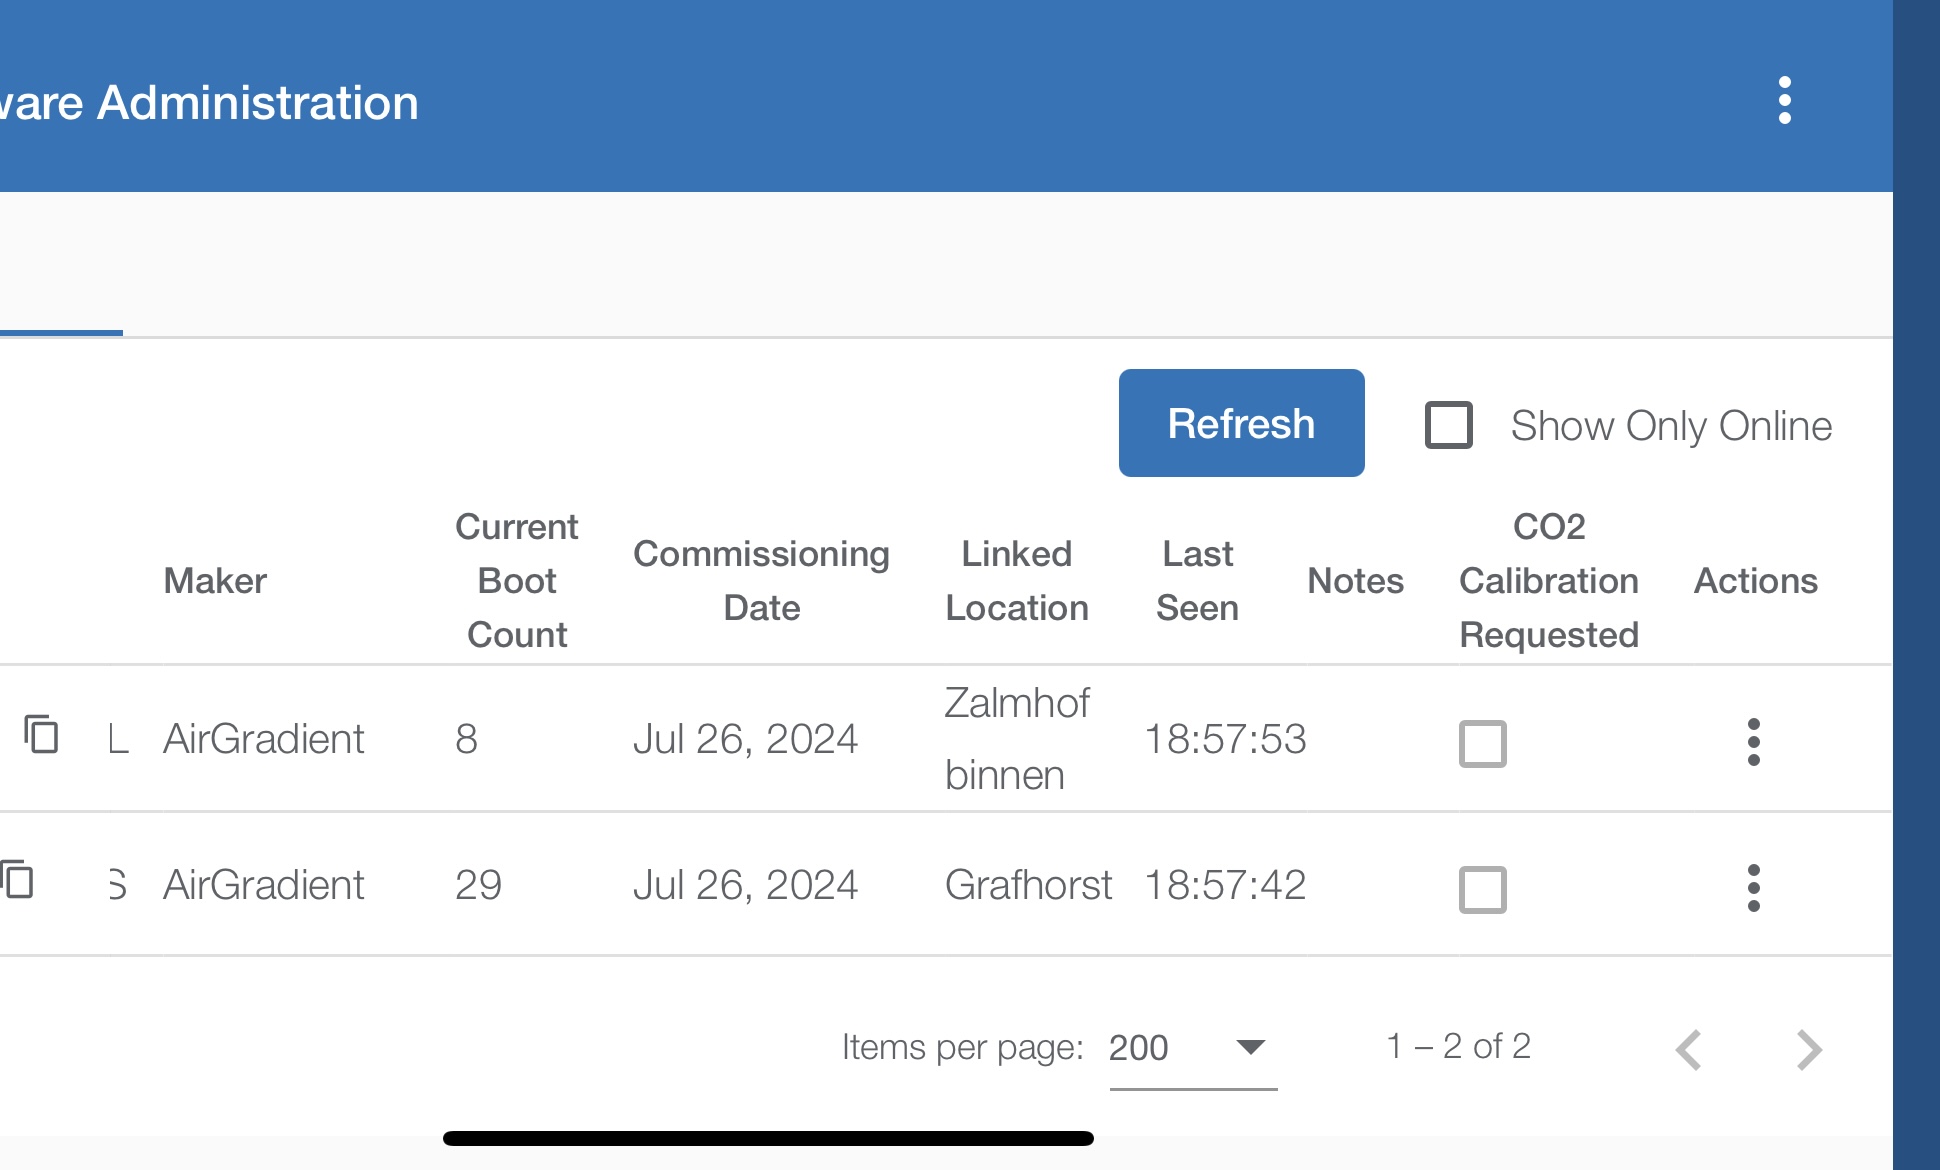
Just FYI, Boot Count is poorly named and doesn’t mean “A count of the number of times this device booted” but it is actually used as a count of how many times it reported to the Dashboard site since the last reboot. so a higher number is better, and when the AirGradient reboots entirely, the Boot Count will reset to 0
Yes I know that’s why I posted the picture. It had a high count but now it was much lower meaning it rebooted at least once and this evening it was complaining again about server n/a.
But even with the sensors in home assistant disabled, both sensors are not stable. The inside sensor has clearly unstable connections, the outside one probably as well.
Little update, it looks like it has run the whole night without any issues… also this morning no message about Server N/A… So how come I have this issue only between 4pm and 11pm (NL timezone)…
And again a little update… The whole day both sensors stable… and just after 6pm the sensor is complaining again about Server N/A… Both sensors still having high boot count.
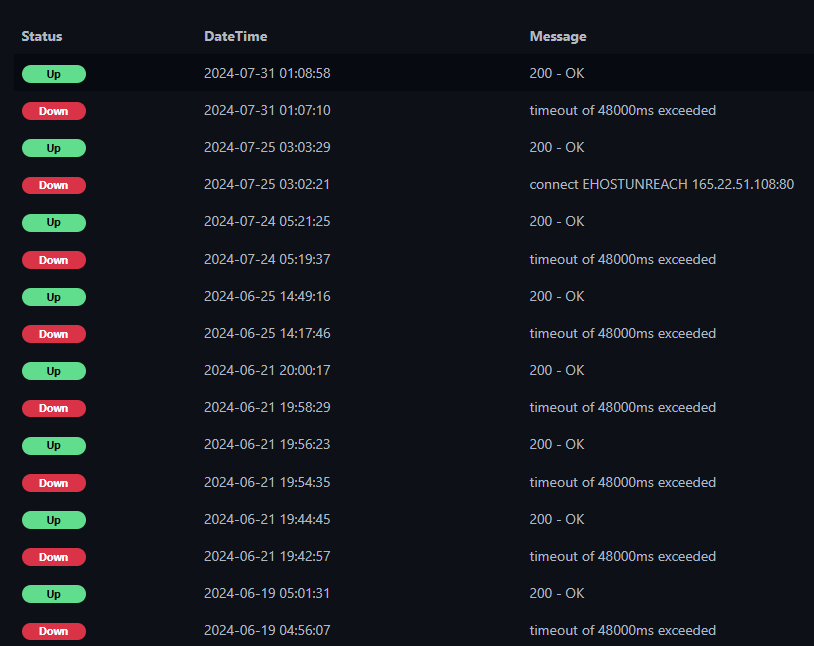
It looks like the API call to the server is not answered in time which causing time outs…
I have tested hw.airgradient.com every 30 seconds on web availability of the nginx server app, server stays reachable from my laptop. A ping command to both sensors during the whole day, stable wifi signal.
How come the network is still working, no issues, both sensors working the whole night and day except the evening…
I’m currently also seeing “Server N/A” right now on my monitor.
Thanks for posting all this information.
To be honest, I don’t really have any explanation for this. It is definitely nothing I have seen or heard before so I would assume it is some local issue.
Can you try and connect the monitor to a completely different router to see if it’s maybe related to some router settings?
We are aware of these server issues and working on increasing the stability of our backend but I think they are different from what @Martijntjuhhh describes.
I think the symptoms @MallocArray is posting is causing the issue. The outages from @MallocArray are less often.
Yesterday I connected the sensor via USB to my laptop to read the log file, each time the server was not available I saw the log entry about API call was not answered in time. I can try to get the exact message tomorrow.
Which timezone are you in @MallocArray ?
Edit:
Just now, the sensor got the server n/a error.
Between 22.05 and 22.07 (NL timezone).
After a short time (22.08) the led goes off and the sensor is ok again.
Central Time US
Even though Uptime Kuma wasn’t notifying that the exact time, when I posted, I was actively seeing the message on the Sensor, so it is happening right now.
Could you please share the server logs with us. Just send via our support form:
After a couple of days without issues, even with the sensors enabled in HA…. I just received the error Server N/A. And it also rebooted now, after boot is says server connected successfully. But then it stays with a purple led.
Just weird, it looks like it isn’t my sensor if it is working for a couple of days without issues.
How do you want me to retrieve the logs. I have than take the sensor offline and connect to my laptop (which inhale to use for work) and wait for the error again?? Or does it have history logs??
As of today purple Led is on and the device restarted and gave notice firmware update failed.
Firmware Version: 3.1.4
Model: I-9PSL
This night a lot email notices that both the Airgradient sensors were offline.
Server N/A comes and goes, its connected on the same Wifi as all other devices that i use in the house.
As it keeps displaying upgrade failed and shows often server not available, I upgraded manually through here:
https://www.airgradient.com/documentation/firmwares/
Here is the log after the update, because it was already connected to the MacBook so I copied it right-away.
firmwareCheckForUpdate:
firmwareCheckForUpdate: Perform
checking for new OTA update @ http://hw.airgradient.com/sensors/airgradient:xxxxxxx/generic/os/firmware.bin?current_firmware=3.1.5
Starting OTA update …
Writing to partition subtype 17 at offset 0x1f0000
File size: 1374592 bytes
OTA message:
OTA message: 0
OTA message: 0
OTA message: 0
OTA message: 1
OTA message: 1
OTA message: 1
OTA message: 1
OTA message: 2
OTA message: 2
OTA message: 2
OTA message: 2
OTA message: 3
OTA message: 3
OTA message: 3
OTA message: 3
OTA message: 3
OTA message: 4
OTA message: 4
OTA message: 4
OTA message: 4
OTA message: 5
OTA message: 5
OTA message: 5
OTA message: 6
OTA message: 6
OTA message: 6
OTA message: 7
OTA message: 7
OTA message: 7
OTA message: 7
OTA message: 8
OTA message: 8
OTA message: 8
OTA message: 9
OTA message: 9
OTA message: 9
OTA message: 9
OTA message: 10
OTA message: 10
OTA message: 10
OTA message: 10
OTA message: 11
OTA message: 11
OTA message: 11
OTA message: 12
OTA message: 12
OTA message: 12
OTA message: 13
OTA message: 13
OTA message: 13
OTA message: 14
OTA message: 14
OTA message: 14
OTA message: 14
OTA message: 15
OTA message: 15
OTA message: 15
OTA message: 16
OTA message: 16
OTA message: 16
OTA message: 16
OTA message: 16
OTA message: 16
OTA message: 17
OTA message: 17
OTA message: 17
OTA message: 17
OTA message: 17
OTA message: 18
OTA message: 18
OTA message: 18
OTA message: 19
OTA message: 19
OTA message: 19
OTA message: 19
OTA message: 100
Connection closed, all data received
of bytes written: 266399
E (109285) esp_image: invalid segment length 0xffffffff
Error: esp_ota_end failed! err=0x5379. Image is invalid2
OTA message:
[ApiClient] Info: GET: http://hw.airgradient.com/sensors/airgradient:xxxxxx/one/config
[ApiClient] Info: Return code: -1
Display brightness: 100
[ApiClient] Info: POST: http://hw.airgradient.com/sensors/airgradient:xxxx/measures
[ApiClient] Info: DATA: {“wifi”:-63,“pm02Compensated”:5,“boot”:0,“bootCount”:0}
[ApiClient] Info: Return code: 200
Online mode and isPostToAirGradient = true: watchdog reset
Not allowed multiple replys, so i copy the message below:
It kept also showing server not available. So i decided to upgrade again and wipe the device.
After updating it had to be reconnected to Wifi. So i connected to the hotspot and tried to configure it for Wifi. I did choose to show the password, to be sure that is was correct what i typed… But the device gave errors on the Console:
[ 78305][E][WebServer.cpp:649] _handleRequest(): request handler not found
[ 87220][E][WebServer.cpp:649] _handleRequest(): request handler not found
[ 93127][E][WebServer.cpp:649] _handleRequest(): request handler not found
[ 97119][E][WebServer.cpp:649] _handleRequest(): request handler not found
After a while i decided to upgrade again because connecting to the hotspot after powercycle was not stable. After the upgrade connected again to hotspot and did configure the wifi again but this time not with password visible. And the wifi configuration did succeed.
Still it is the same, Server N/A and the OTA did not succeed.
Sensor is working but purple light is on, at the moment.
I need to update the above trouble with my findings today as it is appropriate to do so.
I have an musicstreamer active that plays without any interruptions, so i did not suspect any wifi trouble. But i totally forgot that any player for music and video will buffer its data to overcome interruptions.
But the Airgradient is sensitive to wifi trouble as it seems, so therefor generating errors…
Today i checked if there where some updates done in the unifi system, and see there, the 26th of aug it was updated, at that moment i checked other iot devices and saw very bad signal strength on 2.4ghz devices.
Well the conclusion is that the device is ok, but i find the different errors it is producing confusing.
I have to give Achim credits, he was right with his comment that it should be local connection trouble.
In this case my apologies for taking time recources.